
Works a long time in my vape
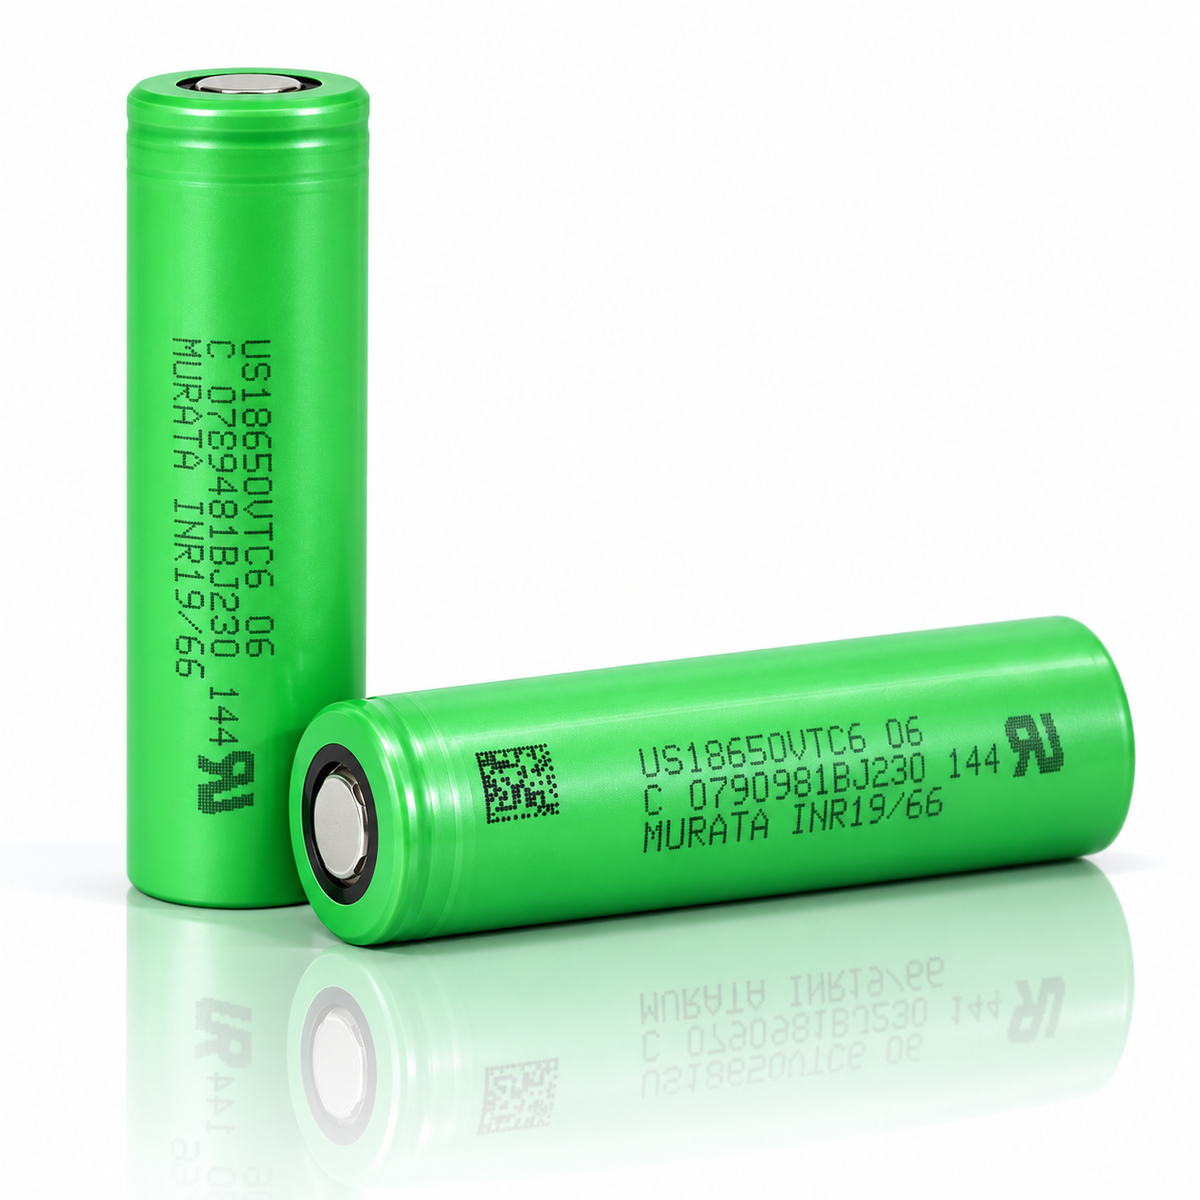
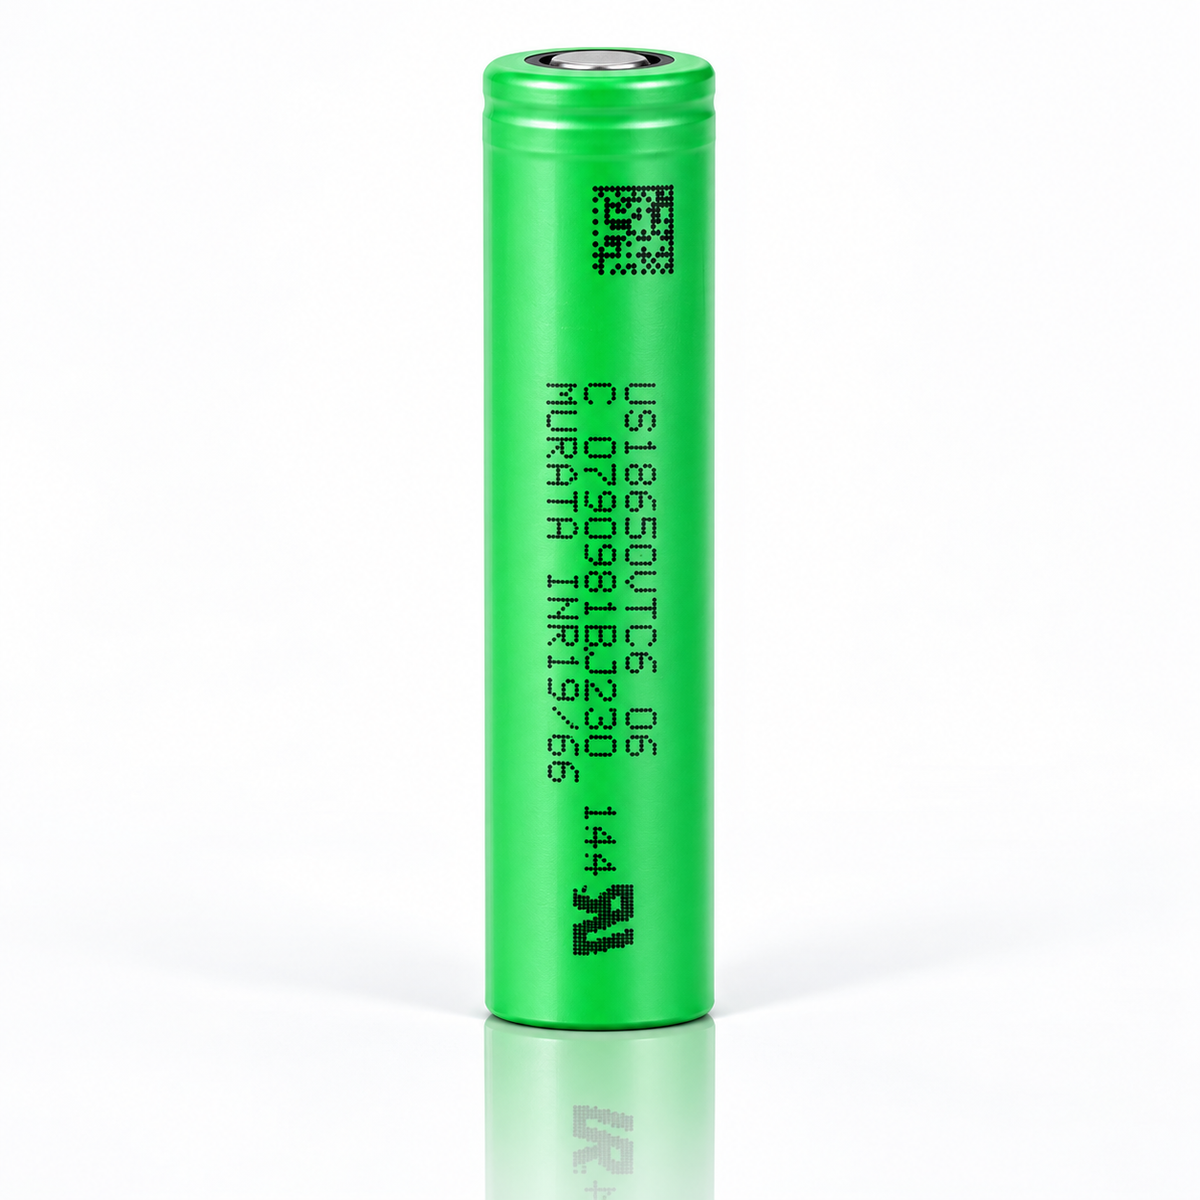


KEY SPECS · SONY US18650VTC6
SOURCE [1]- SIZE
- Ø18.35 × 65.00 mm
- nominal +0.15/-0.20 / ±0.2
- CAPACITY
- 3,120 mAh typ.
- 3,000 mAh min.
- 0.2ItA to 2.0 V
- CURRENT
- 15 A
- max. continuous
- without 80 °C temp. cut
- 30 A
- max. continuous
- with 80 °C temp. cut
- TEMPERATURE
- −20 to 60 °C
- discharge · ambient
- charge 0 to 60 °C · ambient
SONY · MURATA · 18650 · US18650VTC6
An 18650 lithium-ion cell rated 3,000 mAh minimum and 3,120 mAh nominal, at 0.2ItA to 2.0 V after a standard charge [1][2], with two continuous discharge ratings: 15 A “(Without 80 deg temperature cut)” and 30 A “(With 80 deg temperature cut)” [1]. Below: every rating with its condition, Murata’s own curves digitized, and what we calculated from them, so you can check each number.
CAPACITY3,000 mAhrated minimum; 3,120 nominal; 0.2ItA to 2.0 V [1][2]
CONTINUOUS DISCHARGE15 · 30 A15 A without, 30 A with the 80 deg temperature cut · [1] §2.5
CONTINUOUS CHARGE5.0 A“Continuous”; 10–60 ℃ cell surface only · [1] §2.4, fig 5.4
ENERGY10.8 Whrated; 11.3 Wh nominal · SDS [3]
AC IMPEDANCE8–18 mΩ1 kHz, after standard charge [1] §5.5.2
MASS46.6 g± 1.5 g [1]; typical [2]
DATA SHEET · VERSION 001 · PDFSDS · PDFUN38.3 REPORT · PDFALL DATA SHEETSFLAT TOPUNPROTECTEDBARE CELL
A bare cell: a component for protected packs and devices built for it. Not for vaping. Charge on a lithium-ion (Li-ion) charger that stops at 4.2 V.
01SPEC PLATE
Every rating, with its condition.
Two documents describe this cell. The ratings come from Sony’s 15-page Product Specifications [1], Ver. 0.1 of 2015, a tentative engineering specification for pack makers. It is marked [Confidential] and Tentative, so we quote it but don’t post it. Murata’s one-page data sheet [2], Version 001, is public and linked above: it prints the capacities, nominal voltage, mass and size, and four charts, but no current, voltage or temperature limits. Where they overlap they agree. Then come figures we read from the data sheet’s charts, our arithmetic, and facts from the safety data sheet (SDS) [3] and the UN38.3 transport test reports [4][5]. Each row names its source or shows its formula.
| SPECIFICATION | VALUE | CONDITION · SOURCE |
|---|---|---|
| RATED · MANUFACTURER copied from specification [1] and data sheet [2] | ||
| MODEL CODE | US18650VTC6 | as printed [1][2]; designation INR19/66 [1] §1.4 |
| CAPACITY, RATED | 3,000 mAh | “Rated Capacity”: “Discharge at 0.2ItA,2.0Vcutoff after Standard Charge” [1] §2.1; “Rated (minimum) Capacity*” [2] |
| CAPACITY, NOMINAL | 3,120 mAh | same condition [1] §3.1; “Nominal Capacity*” [2]; no capacity is labeled typical |
| NOMINAL VOLTAGE | 3.6 V | [1] §3.2, [2]; “Average Operating Voltage” in [3] |
| CHARGE VOLTAGE | 4.20 V | “Charge Voltage” [1] §3.3; standard charge at 4.20V( +/- 0.005V) [1] §5.3 |
| MAXIMUM CHARGE VOLTAGE | 4.25 V | “Maximum Charge Voltage” [1] §2.2: an upper limit, 4.20V above 45℃ cell surface and 4.15V in condition B below 10℃ [1] §2.8.1; use a charger that stops at 4.2 V |
| CUT OFF VOLTAGE | 2.0 V | “Cut Off Voltage” [1] §2.3, the end of the 0.2ItA capacity discharge; see the next row |
| DISCHARGE, AVOID BELOW | 2.5 V | “*It shall avoid less than 2.5V by discharging.” [1] §8.2.2; the 3.0A, 10A and 15A capacity clauses end at 2.5V [1] §5.5.3 |
| STANDARD CHARGE | 3.0 A | CC-CV at 4.20V( +/- 0.005V) for 2.5 hours, 23 +/-2℃ [1] §5.3; “CCCV, 3.0 A, 4.2 V, 2.5 h, at 23deg.C” [2] |
| CONTINUOUS MAXIMUM CHARGE | 5.0 A | “Continuous” [1] §2.4; 5.00A maximum only from 10 to 60℃ cell surface, 2.00A or 4.00A from 0 to 10℃ [1] §2.8.1 (fig 5.4); the pulse figure in the same row is left out |
| CONTINUOUS MAX. DISCHARGE, NO CUT | 15 A | “(Without 80 deg temperature cut)” [1] §2.5 |
| CONTINUOUS MAX. DISCHARGE, 80 °C CUT | 30 A | “(With 80 deg temperature cut)” [1] §2.5; “Discharge at cell surface temperature below 80℃.” [1] §2.8.2; pack over-temperature protection to operate discharging “until 80degC.(Including overshoot).” [1] §8.2.4.4 |
| CHARGE TEMPERATURE | 0 to 60 °C | “0~+60℃” [1] §2.6, “Allowable Environment Temperature”; above 45℃ cell surface only at 4.20V, 5.00A maximum, 2.00A recommended [1] §2.8.1; the SDS prints 0 to 45 °C (plate below) |
| DISCHARGE TEMPERATURE | −20 to 60 °C | “-20~+60℃”, “Allowable Environment Temperature” [1] §2.6; the same range in [3] §7 |
| CELL SURFACE, DISCHARGE | < 80 °C | “Discharge at cell surface temperature below 80℃.” [1] §2.8.2 |
| AC IMPEDANCE | 8–18 mΩ | “8mΩ~18mΩ” at 1kHz, after standard charge within 3 days, and as shipped [1] §5.5.2; no DC resistance printed |
| ENERGY DENSITY | 631 Wh/l | as printed in the Nominal column [1] §3.4; basis not printed |
| AS SHIPPED | 3.25–3.65 V | open-circuit voltage, within 0.04V on the same cell lot [1] §5.5.1; “About 75% discharged.” [1] §2 |
| DIAMETER | 18.35 mm | +0.15 / −0.20 mm, crimp and trunk [1] §4.1; “Max. 18.5 mm”, with tube [2] |
| HEIGHT | 65.00 mm | ± 0.2 mm [1] §4.1; “Max. 65.2mm” [2] |
| MASS | 46.6 g | ± 1.5 g [1] §2.7; 46.6 g “Weight (typical)” [2] |
| SHAPE · TUBE | Cylindrical · with tube | [2]; tube material and color not printed |
| TERMINAL · PROTECTION | Flat top · none | as sold: bare cell, no protection circuit; the outline in [1] shows a “Flat portion” (φ7.4) at the positive end and names no terminal style |
| MINIMUMS · SPECIFICATION electrical performance, cycle and storage, as printed [1] §5.5 | ||
| MINIMUM AT 0.2ItA | 3,000 mAh | 600mA to 2.0V after standard charging [1] §5.5.3.1 |
| MINIMUM AT 3.0 A | 2,850 mAh | “Standard discharging”, 3.0A to 2.5V, after standard charging [1] §5.5.3.2 |
| MINIMUM AT 10 A | 2,700 mAh | to 2.5V after standard charging [1] §5.5.3.3 |
| MINIMUM AT 15 A | 2,400 mAh | to 2.5V after standard charging [1] §5.5.3.4 |
| MINIMUM AT −10 °C | 1,890 mAh | 10A to 2.5V after standard charging, discharged at −10℃ [1] §5.5.7 |
| MINIMUM AT 0 °C | 2,160 mAh | 10A to 2.5V after standard charging, discharged at 0℃ [1] §5.5.7 |
| AFTER A 0 °C CHARGE | 2,423 mAh | charged 4.20V, 3.00A, 2.5h at 0℃, then standard discharging [1] §5.5.8 |
| CYCLE LIFE | ≥ 1,600 mAh | after 300cycles: charge 4.2V, 4.0A, cut-off 100mA; discharge 10A to 2.5V [1] §5.5.4; no percent basis printed |
| AFTER 28 DAYS AT 45 °C | 2,295 mAh | remaining, 10A to 2.5V, from standard charge; 2,430 mAh recovered after a standard charge [1] §5.5.5 |
| AFTER 365 DAYS AT 23 °C | 2,430 mAh | recovered: standard charge, then 10A to 2.5V [1] §5.5.6 |
| + Source: [1] Sony Energy Devices Corporation, Product Specifications (Tentative), SONY parts name US18650VTC6, Ver. 0.1, 2015.06.30 (1st issue, as printed; the Spec. No. field holds a placeholder); on file since 2020-11-10; not posted, as Sony marks it [Confidential] and Tentative. Questions about its figures: call or text us + Source: [2] Murata Manufacturing Co., Ltd., Cylindrical Type Lithium Ion Secondary Battery US18650VTC6, Version 001 (no date printed); on file 2026-10-20 · Data sheet PDF | ||
| SPECIFICATION | VALUE | CONDITION · SOURCE |
|---|---|---|
| READ FROM DATA-SHEET CHARTS traced from the raster chart images in [2]; reading error about ±20 mAh, ±0.02 V (±0.03 V on the temperature chart) and ±1 °C | ||
| CAPACITY AT 3 A | 3,018 mAh | to 2.5 V, ambient 23deg.C, after a 4.2V/3.0A/150mA charge [2] |
| CAPACITY AT 15 A | 2,982 mAh | to 2.5 V; cell surface about 75 °C at the end [2] |
| CAPACITY AT 20 A | 2,209 mAh | ended by the 80deg.C cut at 3.12 V [2] |
| CAPACITY AT 30 A | 1,298 mAh | ended by the 80deg.C cut at 3.15 V [2] |
| CAPACITY AT −20 °C | 2,917 mAh | 10 A to 2.5 V, charged at 23deg.C; 99 % of the 23 °C curve [2] |
| CHARGE, CONSTANT-CURRENT STAGE | 2,579 mAh | at 3.0 A until 4.2 V; 3,052 mAh in all at the 150mA cut [2] |
| CAPACITY AT CYCLE 300 | 2,271 mAh | 4A charge, 10A discharge, “2.5V or 75deg.C cut-off”, 23deg.C; 2,066 mAh at cycle 500 [2] |
| CALCULATED arithmetic on [1] and [2], shown so you can check it | ||
| 1C (1 ItA) | 3.0 A | 600mA ÷ 0.2, from “0.2ItA(600mA)” [1] §5.5.3.1 and “0.2 ItA (600 mA)” [2] |
| CONTINUOUS DISCHARGE AS C-RATE | 5C · 10C | 15 A “(Without 80 deg temperature cut)” ÷ 3.0 A; 30 A “(With 80 deg temperature cut)” ÷ 3.0 A [1] §2.5 |
| CONTINUOUS CHARGE AS C-RATE | 1.7C | 5.0 A “Continuous” [1] §2.4 ÷ 3.0 A; only from 10 to 60℃ cell surface [1] §2.8.1 |
| ENERGY AT 3 A | 10.74 Wh | ∫V dQ along the 3 A curve to 2.5 V [2] |
| ENERGY AT 30 A | 4.22 Wh | ∫V dQ along the 30 A curve, to the 80deg.C cut [2] |
| AVERAGE POWER AT 30 A | 98 W | 30 A × 3.25 V average of that curve [2]; a test at the 30 A “(With 80 deg temperature cut)” rating [1] |
| CHARGE TIME, 3.0 A TEST | 78 min | t = ∫dQ ÷ I along the current trace [2]: 52 min at 3.0 A, then the taper to the 150mA cut |
| ENERGY, NOMINAL ARITHMETIC | 11.23 Wh | 3.6 V × 3,120 mAh [1] §3.1–3.2; [3] prints 11.3 Wh |
| VOLUME | 17.5 cm³ | π × (18.5 ÷ 2)² × 65.2 mm³, the maximum size with tube [2] |
| FROM THE SAFETY DATA SHEET (SDS) AND UN38.3 TRANSPORT TEST REPORTS copied as printed from [3], [4] and [5] | ||
| CHEMISTRY | Li-ion | “Lithium-Ion Rechargeable Battery” [1] §1.2; the SDS lists “Lithium Nickel Cobalt Oxides”, 38% [3] §3 |
| ENERGY · SDS | 11.3 · 10.8 Wh | “Watt-hour rating”, “11.3 Wh / 10.8 Wh (Nominal / Rated)” [3] §3 |
| ENERGY · UN38.3 | 10.8 Wh | “Watt-hour rating”, with 3.6 V and 3000 mAh rated [4] |
| CHARGE TEMPERATURE · SDS | 0 to 45 °C | “Charge within the limits of 0°C to 45°C (32°F to 113°F) temperature.” [3] §7; [1] prints “0~+60℃” |
| STORAGE · SDS | −20 to 45 °C | “Store within the recommended limit of -20°C to 45°C (-4°F to 113°F), well-ventilated area.” [3] §7 |
| MASS · UN38.3 TEST CELLS | 46.36–46.47 g | the 10 cells weighed before T1 [4]; not our lot |
| TRANSPORT | UN3480 | “UN number” [3] §3; UN3481 when packed with or installed in equipment [3] §14 |
| UN38.3 | QA-7231 | OK for T1–T6 and T8; T7 not applicable to a cell; Tohoku Murata’s own certification, 2017/09/01, of tests run 2015/07/14~2015/07/29 [4]; Sony’s QA-C5111 reports the same run [5] |
| SAFETY DATA SHEET | TMM-TR-A26048 | Date Prepared Jan. 01, 2026; no version printed; Tohoku Murata [3] |
| + Source: [1] Sony Energy Devices Corporation, Product Specifications (Tentative), SONY parts name US18650VTC6, Ver. 0.1, 2015.06.30 (1st issue, as printed; the Spec. No. field holds a placeholder); on file since 2020-11-10; not posted, as Sony marks it [Confidential] and Tentative. Questions about its figures: call or text us + Source: [2] Murata Manufacturing Co., Ltd., Cylindrical Type Lithium Ion Secondary Battery US18650VTC6, Version 001 (no date printed); on file 2026-10-20 · Data sheet PDF + Source: [3] Tohoku Murata Manufacturing Co., Ltd., Safety Data Sheet No. TMM-TR-A26048, Model Name US18650VTC6, Date Prepared Jan. 01, 2026 (no version printed); on file 2026-10-20 · SDS PDF + Source: [4] Tohoku Murata Manufacturing Co., Ltd., Lithium-ion (polymer) rechargeable cell or battery Certification No. QA-7231, Murata model name US18650VTC6, dated 2017/09/01, cell tests 2015/07/14~2015/07/29, to the UN Manual of Tests and Criteria 5th revised edition Amendment 2, Part Ⅲ, subsection 38.3; signed by its own Quality Assurance Department; on file 2026-10-20 · UN38.3 report PDF + Source: [5] Sony Energy Devices Corporation, Lithium-ion (polymer) rechargeable cell or battery Certification No. QA-C5111, US18650VTC6, dated 2015/10/07, the same cell tests (2015/07/14~2015/07/29); signed by its own Quality Assurance Department; on file, not posted: [4] restates its cell results, and [4] is the copy we post | ||
RATED · [1] + DIGITIZEDFIG 1.1
Voltage window
Cut Off Voltage 2.0V, the end of the 0.2ItA capacity test [1] §2.3
2.0
Avoid below “*It shall avoid less than 2.5V by discharging.” [1] §8.2.2
2.5
Nominal Voltage 3.6V [1] §3.2, [2]
3.6
Charge Voltage 4.20V [1] §3.3
4.20
Maximum Charge Voltage 4.25V, an upper limit [1] §2.2
4.25
Middle 80 % of capacity at 3 A 3.09–3.96 V, digitized from [2]
Black marks: voltages as printed in [1], each with its label. Orange bar: where the middle 80 % of capacity is delivered at 3 A, 3.09–3.96 V, read from the 3 A curve traced from [2]. The scale runs from 1.8 to 4.6 V.
RATED · [1]FIG 1.2
Current limits
Standard charge 3.0 A · 1C · CC-CV 4.20V, 2.5 hours [1] §5.3
3.0 A
Continuous maximum charge 5.0 A · 1.7C · “Continuous”; 10 to 60℃ cell surface only [1] §2.4, §2.8.1
5.0 A
Continuous maximum discharge 15 A · 5C · “(Without 80 deg temperature cut)” [1] §2.5
15 A
Continuous maximum discharge 30 A · 10C · “(With 80 deg temperature cut)” [1] §2.5
30 A
Currents as rated in [1], each with its printed condition. C-rates against 1C = 3.0 A, from “0.2ItA(600mA)”. The 30 A rating holds only with the 80 °C cut; without it the rating is 15 A. [1] prints no pulse discharge rating; the pulse figure beside the 5.0A charge rating is left out.
RATED · [1][3]FIG 1.3
Temperature envelope
Discharge, ambient “-20~+60℃” [1] §2.6; the same in [3] §7
Discharge, cell surface below 80 ℃ [1] §2.8.2
Charge, ambient “0~+60℃” [1] §2.6
Charge, SDS 0 to 45 °C [3] §7
Charge limits, cell surface steps at 10 and 45 ℃, 0 to 60 ℃ [1] §2.8.1 (fig 5.4)
Printed test points temperature chart [2], −20 to 75 °C
Operating ranges as printed, in °C. Orange: 0 to 45 °C, the charge range both [1] and [3] allow. [1] §8.4 also says “*Do not use the battery in a place of high temperature (60degC or more).” Last row: the test temperatures of the data sheet’s discharge-temperature chart (section 04 below); 75 °C is above the rated discharge range.
DOCUMENTS · [1]–[4]FIG 1.4
Capacity, as each document prints it
Rated, specification ≥ 3,000 mAh, 0.2ItA to 2.0V [1] §2.1
3,000
Nominal, specification 3,120 mAh, same condition [1] §3.1
3,120
Data sheet “Rated (minimum)” 3000 mAh, “Nominal” 3120 mAh [2]
SDS rated 3000 mAh, nominal 3120 mAh [3]
UN38.3 report rated capacity 3000 mAh [4]
3,000
Each document’s capacity figures, as printed, on a 2,900–3,200 mAh scale; the axis doesn’t start at zero. All four agree: 3,000 mAh rated (minimum) and 3,120 mAh nominal, at 0.2ItA (600 mA) to 2.0 V after a standard charge [1][2]. None labels a capacity figure typical.
DOCUMENTS · [1]–[4]FIG 1.5
Energy, by document
SDS, nominal “11.3 Wh” for 3120 mAh [3]
11.3
SDS, rated “10.8 Wh” for 3000 mAh [3]
10.8
UN38.3 report “Watt-hour rating” [4]
10.8
Nominal, calculated 3.6 V × 3,120 mAh [1]
11.23
3 A curve, calculated ∫V dQ to 2.5 V [2]
10.74
Energy figures in Wh on a 10.4–11.6 Wh scale. 10.8 Wh is 3.6 V × 3.0 Ah, the rated capacity [3][4]. 3.6 V × 3.12 Ah gives 11.23 Wh, not the 11.3 Wh [3] prints, and [3] doesn’t print its basis. [1] and [2] print no Wh. Our integration of the 3 A curve is the last row; it ends at 2.5 V, not 2.0 V. Shipping paperwork follows the SDS.
DOCUMENTS · [1]–[4]FIG 1.6
Mass, by document
Specification 46.6 ± 1.5 g [1] §2.7
Data sheet 46.6 g “Weight (typical)” [2]
46.6
UN38.3 test cells 46.36–46.47 g, 10 cells [4]
Mass in grams on a 44.5–48.5 g scale. Top bar: the 45.1–48.1 g band that 46.6 ± 1.5 g allows [1]. Bottom bar: the range of the 10 cells weighed before UN38.3 test T1 in 2015 [4], a maker sample, not our lot. The SDS prints no mass [3].
02 · DISCHARGE
Discharge at 3 A and 30 A.
The data sheet’s lowest and highest discharge currents, digitized. At 3 A the cell runs to 2.5 V and delivers about 3,018 mAh. At 30 A the discharge ends after about 1,298 mAh, still at 3.15 V, when the cell surface reaches 80 °C: the chart’s “2.5Vcut or 80deg.C cut”. That is the cut the 30 A rating needs, “(With 80 deg temperature cut)”; without it the rating is 15 A “(Without 80 deg temperature cut)” [1] §2.5.
3 A · 1C10.74 Whabout 3,018 mAh to 2.5 V · digitized from [2]; Wh calculated
30 A · 10C4.22 Whabout 1,298 mAh, 2.6 min, to the 80deg.C cut · digitized from [2]; Wh and min calculated
DIGITIZED FROM [2]FIG 2.1
V
2.53.03.54.04.201,0002,0003,0003 A · 1C30 A · 10C
Capacity, mAh
Data: digitized from [2] “Discharge characteristics by discharge late” · 3 A and 30 A · charge “4.2V/3.0A/150mAcut” · discharge CC to “2.5Vcut or 80deg.C cut” · ambient 23deg.C · traced from the raster chart images in [2]; reading error about ±20 mAh, ±0.02 V (±0.03 V on the temperature chart) and ±1 °C · data tables under figs 3.1 and 3.2
03BY CURRENT
Capacity, energy and runtime, by current.
Six discharge currents from the data sheet, from 3 to 30 A, each with the cell’s surface temperature. Figs 3.1 to 3.5 are read from the charts, fig 3.5 beside the minimums the specification sets at four currents; the rest are arithmetic on the curves, with the formula under each. At 20 and 30 A the 80deg.C cut ends the discharge before 2.5 V.
DIGITIZED FROM [2]FIG 3.1
Discharge at 3, 5 and 10 A
3 A · 1C5 A · 1.7C10 A · 3.3C
V
2.53.03.54.001,0002,0003,000
Capacity, mAh
Data: digitized from [2] “Discharge characteristics by discharge late” · 3 A, 5 A, 10 A · charge “4.2V/3.0A/150mAcut” · discharge CC to “2.5Vcut or 80deg.C cut” · ambient 23deg.C · traced from the raster chart image; reading error about ±20 mAh and ±0.02 V
DATA TABLE · FIG 3.1
| SERIES | V AT 100 mAh | 500 | 1,000 | 1,500 | 2,000 | 2,500 | END mAh | END V | ENDED AT |
|---|---|---|---|---|---|---|---|---|---|
| 3 A · 1C | 4.01 | 3.92 | 3.76 | 3.62 | 3.46 | 3.26 | 3,018 | 2.49 | 2.5 V |
| 5 A · 1.7C | 3.95 | 3.86 | 3.71 | 3.56 | 3.41 | 3.22 | 3,004 | 2.50 | 2.5 V |
| 10 A · 3.3C | 3.83 | 3.73 | 3.60 | 3.46 | 3.31 | 3.13 | 2,994 | 2.49 | 2.5 V |
DIGITIZED FROM [2]FIG 3.2
Discharge at 15, 20 and 30 A
15 A · 5C20 A · 6.7C30 A · 10C
V
2.53.03.54.001,0002,0003,000
Capacity, mAh
Data: digitized from [2] “Discharge characteristics by discharge late” · 15 A, 20 A, 30 A · charge “4.2V/3.0A/150mAcut” · discharge CC to “2.5Vcut or 80deg.C cut” · ambient 23deg.C · traced from the raster chart image; reading error about ±20 mAh and ±0.02 V
DATA TABLE · FIG 3.2
| SERIES | V AT 100 mAh | 500 | 1,000 | 1,500 | 2,000 | 2,500 | END mAh | END V | ENDED AT |
|---|---|---|---|---|---|---|---|---|---|
| 15 A · 5C | 3.73 | 3.62 | 3.50 | 3.37 | 3.24 | 3.07 | 2,982 | 2.48 | 2.5 V |
| 20 A · 6.7C | 3.61 | 3.50 | 3.39 | 3.29 | 3.17 | trace ended | 2,209 | 3.12 | the 80deg.C cut |
| 30 A · 10C | 3.45 | 3.30 | 3.18 | trace ended | trace ended | trace ended | 1,298 | 3.15 | the 80deg.C cut |
DIGITIZED FROM [2]FIG 3.3
Cell surface temperature, by current
15 A · 5C20 A · 6.7C30 A · 10C
°C
2040608001,0002,0003,000
Capacity, mAh
Data: digitized from the surface-temperature curves in [2] “Discharge characteristics by discharge late” (right axis, “Surface Temperature [deg.C]”) · charge “4.2V/3.0A/150mAcut” · discharge CC to “2.5Vcut or 80deg.C cut” · ambient 23deg.C · traced from the raster chart image; reading error about ±20 mAh and ±1 °C · dotted line: 80 °C. At 20 and 30 A the surface reaches 80 °C and the discharge stops, as the chart’s condition allows; at 15 A it ends near 75 °C at 2.5 V. These are tests in 23deg.C air; in a pack, neighboring cells add heat.
DATA TABLE · FIG 3.3
| SERIES | °C AT 0 mAh | 500 | 1,000 | 1,500 | 2,000 | 2,500 | AT END |
|---|---|---|---|---|---|---|---|
| 15 A · 5C | 22 | 35 | 47 | 56 | 62 | 68 | 75 |
| 20 A · 6.7C | 22 | 39 | 54 | 67 | 77 | trace ended | 80 |
| 30 A · 10C | 22 | 45 | 67 | trace ended | trace ended | trace ended | 80 |
DIGITIZED FROM [2]FIG 3.4
Surface temperature at the end, by current
Cell surface temperature at the end of each discharge curve in [2] “Discharge characteristics by discharge late”, from 22.5 °C at the start in 23deg.C air; traced from the raster chart image; reading error about ±20 mAh and ±1 °C. Orange: the two discharges the 80deg.C cut ended, at 20 and 30 A. Bars start at zero, on a 0–90 °C scale. [1] §2.5 rates 30 A “(With 80 deg temperature cut)” and 15 A “(Without 80 deg temperature cut)”; [1] §2.8.2 asks for discharge “below 80℃” at the cell surface.
DIGITIZED [2] · RATED [1]FIG 3.5
Capacity delivered, by current
End of each digitized curve [2]Minimum, as printed in [1] §5.5.3
Black: capacity at the end of each curve in [2] “Discharge characteristics by discharge late”: to 2.5 V, or at 20 and 30 A to the 80deg.C cut. Gray: the minimum [1] sets at that current after a standard charge, to 2.5 V (to 2.0 V at 0.2ItA). The chart’s charge (4.2V/3.0A/150mA cut) differs a little from [1]’s standard charge (3.0A for 2.5 hours). [1] sets no minimum at 5, 20 or 30 A.
DATA TABLE · FIG 3.5
| CURRENT | C-RATE | CURVE END mAh [2] | CURVE ENDED | MINIMUM mAh [1] | MINIMUM TO |
|---|---|---|---|---|---|
| 0.6 A | 0.2C | no curve | 3,000 | 2.0 V | |
| 3 A | 1C | 3,018 | to 2.5 V | 2,850 | 2.5 V |
| 5 A | 1.7C | 3,004 | to 2.5 V | not printed | |
| 10 A | 3.3C | 2,994 | to 2.5 V | 2,700 | 2.5 V |
| 15 A | 5C | 2,982 | to 2.5 V | 2,400 | 2.5 V |
| 20 A | 6.7C | 2,209 | to the 80deg.C cut | not printed | |
| 30 A | 10C | 1,298 | to the 80deg.C cut | not printed |
CALCULATED FROM [2]FIG 3.6
Energy delivered, by current
Energy = the area under each voltage–capacity curve (∫V dQ), digitized from [2] “Discharge characteristics by discharge late”, to 2.5 V. Orange: 20 and 30 A, whose curves end at the 80deg.C cut. Printed for comparison: 10.8 Wh rated and 11.3 Wh nominal [3].
CALCULATED FROM [2]FIG 3.7
Voltage sag, by current
after 300 mAhafter 700 mAhafter 1,200 mAh
V
3.03.253.53.754.00102030
Discharge current, A
Cell voltage after the same capacity delivered, read from each curve in [2]; depths stop at 1,200 mAh because the 30 A curve ends at 1,298 mAh. At 700 mAh the 30 A curve sits 0.62 V below the 3 A curve: 0.62 V ÷ 27 A ≈ 23 mΩ (21–23 mΩ across the three depths). Effective resistance = (V at 3 A − V at 30 A) ÷ (30 − 3) A at the same capacity delivered; arithmetic, not a rating. [1] prints only an AC impedance, 8–18 mΩ at 1 kHz, a different measurement; the 30 A cell also heats to 80 °C during the test (fig 3.3).
DATA TABLE · FIG 3.7
| DEPTH | 3 A | 5 A | 10 A | 15 A | 20 A | 30 A | mΩ, 3 → 30 A |
|---|---|---|---|---|---|---|---|
| 300 mAh | 3.96 | 3.90 | 3.78 | 3.67 | 3.56 | 3.37 | 22 |
| 700 mAh | 3.86 | 3.81 | 3.68 | 3.57 | 3.46 | 3.24 | 23 |
| 1,200 mAh | 3.71 | 3.65 | 3.55 | 3.45 | 3.35 | 3.16 | 21 |
CALCULATED FROM [2]FIG 3.8
Average power output, by current
Power = current × average voltage of each digitized curve in [2], over the whole discharge: to 2.5 V, or for the orange 20 and 30 A rows to the 80deg.C cut. The start of a discharge runs higher, the end lower.
CALCULATED FROM [2]FIG 3.9
Runtime at a constant current
Runtime = capacity delivered ÷ current, from the curves in [2], from a 4.2V/3.0A/150mA charge in 23deg.C air. Orange: 20 and 30 A, where the 80deg.C cut ended the discharge before 2.5 V. A device whose average draw is below its peak current runs longer than the figure at that peak.
CALCULATED FROM [2]FIG 3.10
Energy against power
Wh
369121020501003 A5 A10 A15 A20 A30 A
Average power, W (log scale)
Each point is one digitized curve from [2] “Discharge characteristics by discharge late”: energy delivered against average power, power on a log scale. Orange points: 20 and 30 A, ended by the 80deg.C cut. The energy falls steeply above 15 A because those discharges stop at 80 °C, not at 2.5 V.
DATA TABLE · FIG 3.10
| CURRENT | AVERAGE W | ENERGY Wh | RUNTIME | ENDED AT |
|---|---|---|---|---|
| 3 A · 1C | 10.7 | 10.74 | 1 h 00 min | to 2.5 V |
| 5 A · 1.7C | 17.5 | 10.54 | 36 min | to 2.5 V |
| 10 A · 3.3C | 34.1 | 10.21 | 18 min | to 2.5 V |
| 15 A · 5C | 49.9 | 9.92 | 12 min | to 2.5 V |
| 20 A · 6.7C | 67.2 | 7.42 | 6.6 min | to the 80deg.C cut |
| 30 A · 10C | 97.6 | 4.22 | 2.6 min | to the 80deg.C cut |
15 A or 30 A?
- 15 A is the continuous maximum “(Without 80 deg temperature cut)” [1] §2.5.
- 30 A is the continuous maximum “(With 80 deg temperature cut)” [1] §2.5: something has to stop the discharge at 80 °C on the cell surface. [1] asks for discharge “below 80℃” at the cell surface (§2.8.2), and for a pack over-temperature circuit that operates discharging “until 80degC.(Including overshoot).” [1] §8.2.4.4. In a pack that is a temperature sensor on the cell, read by the BMS.
- [1] prints no temperature at which discharge may resume.
- The data sheet’s own curves show the cut at work: at 20 and 30 A the discharge ends when the surface reaches 80 °C, after about 2,209 and 1,298 mAh (figs 3.2 and 3.3) [2].
- At 15 A the surface reached about 75 °C by the end, in 23deg.C air (fig 3.3) [2].
- If you don’t know whether your device has a cell-temperature cut-off, use 15 A.
04BY TEMPERATURE
Discharge, by temperature.
Eight test temperatures from −20 to 75 °C, digitized from the data sheet, all at 10 A after a charge at 23 °C. The chart’s condition line reads “-30deg.C to 75deg.C”, but its legend and curves stop at −20 °C, so the figures follow the legend. The chart doesn’t say whether these are ambient or cell temperatures. [1] rates discharge at “-20~+60℃” (§2.6) and sets minimums at −10, 0, 23 and 45 °C (§5.5.7).
DIGITIZED FROM [2]FIG 4.1
Warm: 23, 45 and 60 °C
23 °C45 °C60 °C
V
2.53.03.54.001,0002,0003,000
Capacity, mAh
Data: digitized from [2] “Discharge characteristics by temperature” · charge “23deg.C 4.2V/3A(cc/cv)/150mAcut” · discharge 10 A CC to “2.5Vcut or 80deg.C” at each temperature · the chart doesn’t say whether the temperatures are ambient or cell temperatures · traced from the raster chart image; reading error about ±20 mAh and ±0.03 V
DATA TABLE · FIG 4.1
| SERIES | V AT 100 mAh | 500 | 1,000 | 1,500 | 2,000 | 2,500 | END mAh | END V | ENDED AT |
|---|---|---|---|---|---|---|---|---|---|
| 23 °C | 3.84 | 3.74 | 3.60 | 3.46 | 3.31 | 3.13 | 2,960 | 2.49 | 2.5 V |
| 45 °C | 3.92 | 3.81 | 3.65 | 3.51 | 3.36 | 3.15 | 2,954 | 2.49 | 2.5 V |
| 60 °C | 3.94 | 3.84 | 3.68 | 3.53 | 3.37 | 3.16 | 2,740 | 2.96 | the 80deg.C cut |
DIGITIZED FROM [2]FIG 4.2
Hot: 75 °C, with 23 °C
23 °C75 °C
V
2.53.03.54.001,0002,0003,000
Capacity, mAh
Data: digitized from [2] “Discharge characteristics by temperature” · charge “23deg.C 4.2V/3A(cc/cv)/150mAcut” · discharge 10 A CC to “2.5Vcut or 80deg.C” at each temperature · the chart doesn’t say whether the temperatures are ambient or cell temperatures · traced from the raster chart image; reading error about ±20 mAh and ±0.03 V
DATA TABLE · FIG 4.2
| SERIES | V AT 100 mAh | 500 | 1,000 | 1,500 | 2,000 | 2,500 | END mAh | END V | ENDED AT |
|---|---|---|---|---|---|---|---|---|---|
| 23 °C | 3.84 | 3.74 | 3.60 | 3.46 | 3.31 | 3.13 | 2,960 | 2.49 | 2.5 V |
| 75 °C | 3.95 | 3.86 | trace ended | trace ended | trace ended | trace ended | 973 | 3.70 | the 80deg.C cut |
DIGITIZED FROM [2]FIG 4.3
Cool: 10, 0 and −10 °C
10 °C0 °C−10 °C
V
2.53.03.54.001,0002,0003,000
Capacity, mAh
Data: digitized from [2] “Discharge characteristics by temperature” · charge “23deg.C 4.2V/3A(cc/cv)/150mAcut” · discharge 10 A CC to “2.5Vcut or 80deg.C” at each temperature · the chart doesn’t say whether the temperatures are ambient or cell temperatures · traced from the raster chart image; reading error about ±20 mAh and ±0.03 V
DATA TABLE · FIG 4.3
| SERIES | V AT 100 mAh | 500 | 1,000 | 1,500 | 2,000 | 2,500 | END mAh | END V | ENDED AT |
|---|---|---|---|---|---|---|---|---|---|
| 10 °C | 3.73 | 3.67 | 3.56 | 3.41 | 3.27 | 3.09 | 2,951 | 2.49 | 2.5 V |
| 0 °C | 3.61 | 3.61 | 3.52 | 3.38 | 3.23 | 3.06 | 2,948 | 2.49 | 2.5 V |
| −10 °C | 3.43 | 3.55 | 3.47 | 3.34 | 3.20 | 3.02 | 2,930 | 2.49 | 2.5 V |
DIGITIZED FROM [2]FIG 4.4
Cold: −20 °C, with 23 °C
23 °C−20 °C
V
2.53.03.54.001,0002,0003,000
Capacity, mAh
Data: digitized from [2] “Discharge characteristics by temperature” · charge “23deg.C 4.2V/3A(cc/cv)/150mAcut” · discharge 10 A CC to “2.5Vcut or 80deg.C” at each temperature · the chart doesn’t say whether the temperatures are ambient or cell temperatures · traced from the raster chart image; reading error about ±20 mAh and ±0.03 V
DATA TABLE · FIG 4.4
| SERIES | V AT 100 mAh | 500 | 1,000 | 1,500 | 2,000 | 2,500 | END mAh | END V | ENDED AT |
|---|---|---|---|---|---|---|---|---|---|
| 23 °C | 3.84 | 3.74 | 3.60 | 3.46 | 3.31 | 3.13 | 2,960 | 2.49 | 2.5 V |
| −20 °C | 3.17 | 3.47 | 3.41 | 3.29 | 3.16 | 2.98 | 2,917 | 2.49 | 2.5 V |
DIGITIZED FROM [2]FIG 4.5
Cell surface temperature, by test temperature
−20 °C23 °C60 °C
°C
−2002040608001,0002,0003,000
Capacity, mAh
Data: digitized from the surface-temperature curves in [2] “Discharge characteristics by temperature” (right axis) · 10 A · traced from the raster chart image; reading error about ±20 mAh and ±1 °C · dotted line: 80 °C. The cell warms itself: at −20 °C the surface ends near 35 °C. At 60 °C (and at 75 °C) it reaches 80 °C and the discharge stops. The data table lists all eight curves; the surface lines run slightly past the voltage lines’ ends, as printed.
DATA TABLE · FIG 4.5
| SERIES | °C AT 0 mAh | 500 | 1,000 | 1,500 | 2,000 | 2,500 | AT VOLTAGE END |
|---|---|---|---|---|---|---|---|
| 75 °C | 73 | 77 | trace ended | trace ended | trace ended | trace ended | 80 |
| 60 °C | 59 | 64 | 67 | 72 | 75 | 78 | 80 |
| 45 °C | 44 | 50 | 55 | 60 | 63 | 66 | 71 |
| 23 °C | 22 | 31 | 38 | 44 | 48 | 51 | 56 |
| 10 °C | 10 | 21 | 29 | 35 | 40 | 44 | 49 |
| 0 °C | 0 | 15 | 24 | 30 | 35 | 39 | 44 |
| −10 °C | −10 | 9 | 19 | 26 | 31 | 35 | 39 |
| −20 °C | −20 | 5 | 16 | 22 | 27 | 31 | 35 |
DIGITIZED [2] · RATED [1]FIG 4.6
Capacity delivered, by test temperature
End of each digitized curve [2]Minimum, as printed in [1] §5.5.7
Black: end capacity of each temperature curve in [2], 10 A to 2.5 V, or to the 80deg.C cut at 60 and 75 °C. Gray: the minimum [1] sets at −10, 0, 23 and 45 °C, also 10A to 2.5V after a standard charge. [1] rates discharge from −20 to 60 °C, so 75 °C is a test point, not a rating.
DATA TABLE · FIG 4.6
| TEMPERATURE | CURVE END mAh [2] | % OF 23 °C | CURVE ENDED | MINIMUM mAh [1] |
|---|---|---|---|---|
| 75 °C | 973 | 33 | to the 80deg.C cut | not printed |
| 60 °C | 2,740 | 93 | to the 80deg.C cut | not printed |
| 45 °C | 2,954 | 100 | to 2.5 V | 2,700 |
| 23 °C | 2,960 | 100 | to 2.5 V | 2,700 |
| 10 °C | 2,951 | 100 | to 2.5 V | not printed |
| 0 °C | 2,948 | 100 | to 2.5 V | 2,160 |
| −10 °C | 2,930 | 99 | to 2.5 V | 1,890 |
| −20 °C | 2,917 | 99 | to 2.5 V | not printed |
CALCULATED FROM [2]FIG 4.7
Average voltage, by test temperature
V
3.13.33.53.73.9−200204060803.223.343.433.483.85
Test temperature, °C
Average voltage = energy ÷ capacity for each digitized temperature curve in [2], at 10 A. The line joins the eight curves. Orange point: 23 °C. The 60 and 75 °C averages are over shorter discharges, ended by the 80deg.C cut, so they sit high. Lower voltage at the same current means less power and more heat.
DATA TABLE · FIG 4.7
| TEMPERATURE | CAPACITY mAh | % OF 23 °C | ENERGY Wh | AVERAGE V | ENDED AT |
|---|---|---|---|---|---|
| 75 °C | 973 | 33 | 3.75 | 3.85 | to the 80deg.C cut |
| 60 °C | 2,740 | 93 | 9.74 | 3.55 | to the 80deg.C cut |
| 45 °C | 2,954 | 100 | 10.28 | 3.48 | to 2.5 V |
| 23 °C | 2,960 | 100 | 10.15 | 3.43 | to 2.5 V |
| 10 °C | 2,951 | 100 | 9.98 | 3.38 | to 2.5 V |
| 0 °C | 2,948 | 100 | 9.84 | 3.34 | to 2.5 V |
| −10 °C | 2,930 | 99 | 9.62 | 3.28 | to 2.5 V |
| −20 °C | 2,917 | 99 | 9.40 | 3.22 | to 2.5 V |
Fig 4.2: 75 °C is above the rated discharge range, “-20~+60℃” [1] §2.6; the discharge ended after about 973 mAh at the 80deg.C cut. Fig 4.4: at −20 °C the voltage first dips to about 3.05 V within the first 50 mAh, then recovers to about 3.47 V as the cell warms itself (fig 4.5). The 23 °C curve here ends at about 2,960 mAh; the 10 A curve in fig 3.1, a separate test, ends at about 2,994 mAh.
05CHARGING
Charging: 3.0 A standard; 5.0 A continuous maximum, by cell temperature.
The data sheet charts one charge, 3.0 A CC-CV to 4.2 V with a 150mA cut, in 23deg.C air [2], against charge put in rather than time. Figs 5.1 and 5.2 are its traces; fig 5.3 works out the minutes. Figs 5.4 to 5.6 come from the specification and the SDS: charge limits by cell surface temperature, capacity after charging at 0, 23 and 45 °C, and each document’s charge temperature range.
DIGITIZED FROM [2]FIG 5.1
Cell voltage while charging
V
3.03.43.84.201,0002,0003,0003.0 A · 1C
Charge capacity, mAh
Data: digitized from [2] “Charge characteristics” · “Charge:4.2V/3.0A/150mAcut” · “Ambient temp : 23deg.C” · x axis: charge put in, not time · traced from the raster chart image; reading error about ±20 mAh, ±0.02 V and ±0.02 A · reaches 4.2 V after about 2,579 mAh
DATA TABLE · FIG 5.1
| CHARGE | 300 | 900 | 1,500 | 2,100 | 2,500 | 2,700 | 2,900 | 3,000 | END |
|---|---|---|---|---|---|---|---|---|---|
| 3.0 A · 1C | 3.54 | 3.70 | 3.87 | 4.04 | 4.18 | 4.20 | 4.20 | 4.20 | 4.20 |
DIGITIZED FROM [2]FIG 5.2
Charge current
A
012301,0002,0003,0003.0 A · 1C
Charge capacity, mAh
Data: digitized from [2] “Charge characteristics” · “Charge:4.2V/3.0A/150mAcut” · “Ambient temp : 23deg.C” · x axis: charge put in, not time · traced from the raster chart image; reading error about ±20 mAh, ±0.02 V and ±0.02 A · 3.0 A to about 2,579 mAh, then the taper
DATA TABLE · FIG 5.2
| CHARGE | 300 | 900 | 1,500 | 2,100 | 2,500 | 2,700 | 2,900 | 3,000 | END |
|---|---|---|---|---|---|---|---|---|---|
| 3.0 A · 1C | 3.00 | 3.00 | 3.00 | 3.00 | 3.00 | 2.32 | 1.31 | 0.56 | 0.15 at 3,052 |
CALCULATED FROM [2]FIG 5.3
Minutes to put in each amount
Minutes to put in each amount, calculated from the current trace digitized from [2]: t = ∫ dQ ÷ I, because the chart plots against charge, not time. 52 min at 3.0 A to 2,579 mAh, then the taper; about 78 min in all (orange) to the 150mA cut at 3,052 mAh. Near the end the current is small, so the ±20 mAh reading error can move the total by several minutes. [1]’s standard charge is timed instead: 3.0A for 2.5 hours (§5.3).
DATA TABLE · FIG 5.3
| CHARGE PUT IN | MINUTES | CURRENT A |
|---|---|---|
| 1,000 mAh | 20.0 | 3.00 |
| 2,000 mAh | 40.0 | 3.00 |
| 2,579 mAh | 51.5 | 3.00 |
| 3,000 mAh | 67.7 | 0.56 |
| 3,052 mAh | 78.0 | 0.15 |
PRINTED IN [1]FIG 5.4
Charge limits, by cell surface temperature
“Maximum Charging Current”“Charging Current Recommendation”
Charge conditions by “Temperature Range / Cell Surface Temperature Range”, as printed in [1] §2.8.1, with each range’s upper charging voltage. “At Low Charging Temperature range, condition A and B are both available. Recommended condition is B.” Above 45℃ the upper limit drops to 4.20V and the recommendation to 2.00A. [1] prints no condition below 0℃: don’t charge there. Bars on a 0–5 A scale.
DATA TABLE · FIG 5.4
| CELL SURFACE | RANGE | UPPER V | MAXIMUM | RECOMMENDED |
|---|---|---|---|---|
| 0℃≦T<10℃ | condition A | 4.25V | 2.00A | 1.00A |
| 0℃≦T<10℃ | condition B (recommended) | 4.15V | 4.00A | 2.00A |
| 10℃≦T≦45℃ | standard | 4.25V | 5.00A | 3.00A |
| 45℃<T≦60℃ | high | 4.20V | 5.00A | 2.00A |
RATED · [1]FIG 5.5
Capacity after charging at 0, 23 and 45 °C
Minimum capacity after charging at each temperature, as rated in [1] §5.5.8: “Charging:4.20V” “3.00A, 2.5h”, then “Standard Discharging” (3.0A to 2.5V at 23℃). Orange: 0 °C, the lowest charge temperature [1] rates. % of the 3,000 mAh rated capacity is our arithmetic; [1] prints mAh only.
RATED · [1][3]FIG 5.6
Charge temperature, by document
Charge, ambient, specification “0~+60℃” [1] §2.6
Charge, cell surface, specification limits step at 10 and 45 ℃ [1] §2.8.1
Charge, SDS 0 to 45 °C [3] §7
Rated test points 0, 23 and 45 ℃ [1] §5.5.8
Where charging is allowed, as each document prints it. [1] allows charging from 0 to 60 ℃ and limits it by cell surface temperature (fig 5.4). The SDS prints “Charge within the limits of 0°C to 45°C (32°F to 113°F) temperature.” [3]. Orange: 0 to 45 °C, where both allow charging. Below 0 °C, don’t charge.
Before you charge above 3.0 A
- 3.0 A is the standard charge, CC-CV at 4.20V for 2.5 hours [1] §5.3. 5.0 A is the continuous maximum, “Continuous” [1] §2.4, allowed only from 10 to 60 ℃ cell surface; from 0 to 10 ℃ the maximum is 4.00A at 4.15V (condition B, recommended) or 2.00A at 4.25V (condition A) [1] §2.8.1 (fig 5.4).
- Above 45 ℃ cell surface, [1] lowers the upper voltage to 4.20V and recommends 2.00A [1] §2.8.1.
- [1] prints 4.25V as the “Maximum Charge Voltage” (§2.2). Use a charger or BMS (battery management system) that ends charge at 4.2 V and stops on cell temperature.
- [1] allows charging from 0 to 60 ℃ (§2.6); the SDS from 0 to 45 °C [3] §7. Both allow 0 to 45 °C: charge there. Below 0 °C, don’t charge.
- [1] prints a pulse charge figure beside the 5.0A rating; it is not a continuous rating and is left out here.
06CYCLE LIFE AND STORAGE
Capacity over 500 cycles, and in storage.
One test program from the data sheet: 4 A charge, 10 A discharge, 23 °C, with a 75deg.C cut-off [2]. Then the specification’s minimums: 1,600 mAh or more after 300 cycles at its own conditions, and the capacity kept after storage [1]. The two cycle figures come from different tests, so they sit in separate figures.
DIGITIZED FROM [2]FIG 6.1
Capacity over 500 cycles
mAh
1,5002,1002,7003,300010020030040050010 A discharge
Cycle
Data: digitized from [2] “Cycle life”, left axis “Discharge Capacity [mAh]” · “Charge : 23deg.C, 4.2V, 4A(CC/CV), 150mA cut-off, Rest:30min” · “Discharge : 23deg.C, 10A, 2.5V or 75deg.C cut-off, Rest:60min” · x axis as printed: “Number of cycle” · traced from the raster chart image; reading error about ±2 cycles, ±20 mAh and ±1 °C · the discharge cut-off here is 75deg.C, not the 80 °C of the other charts and of [1] · axis starts at 1,500 mAh · from a data sheet that says it “has only typical specifications” [2]
DATA TABLE · FIG 6.1
| TEST | FIRST | 100 | 200 | 300 | 400 | 500 CYCLES |
|---|---|---|---|---|---|---|
| 10 A discharge | 3,031 mAh | 2,608 mAh | 2,409 mAh | 2,271 mAh | 2,159 mAh | 2,066 mAh |
DIGITIZED FROM [2]FIG 6.2
Maximum temperature over 500 cycles
°C
40506070800100200300400500“Max Temperature”
Cycle
Data: digitized from [2] “Cycle life”, right axis “Max Temperature [deg.C]” · same test as fig 6.1 · traced from the raster chart image; reading error about ±2 cycles, ±20 mAh and ±1 °C · [2] doesn’t say where the temperature is taken · axis starts at 40 °C
DATA TABLE · FIG 6.2
| TEST | FIRST | 100 | 200 | 300 | 400 | 500 CYCLES |
|---|---|---|---|---|---|---|
| Max temperature | 54.7 °C | 56.0 °C | 58.4 °C | 60.6 °C | 62.1 °C | 63.0 °C |
RATED · [1]FIG 6.3
Minimums after cycling and storage
Minimum capacity as rated in [1] §5.5; each row’s capacity comes from a 10A discharge to 2.5V. Storage rows start from a standard charge: “remaining” is the first discharge after storage, “recovered” the discharge after a fresh standard charge. Orange: the cycle-life clause, 1,600 mAh or more after 300 cycles of 4.0A charge (100mA cut-off) and 10A discharge. Its conditions differ from fig 6.1’s (4A charge to 150mA, a 75deg.C cut-off, rests), so the two are not one test. A minimum, not a warranty.
RATED · [1][3]FIG 6.4
Storage temperature, by document
SDS storage range “-20°C to 45°C”, “recommended limit” [3] §7
Recommended, specification “Recommended Temperature 20degC.”, humidity 50% or less [1] §8.3
Keep free from “high temperature (45degC or more)” [1] §8.3
Do not leave or use at “60degC or more” [1] §8.4; “(60°C/140°F)” [3] §7
Storage temperatures as each document prints them. [1] adds “*The recommendation is DOD(Depth of discharge) 50~80% for long-term storage.”, that is, about 20 to 50 % charge (our arithmetic), and ships cells “About 75% discharged.” [1].
07TRANSPORT TESTS
What the UN38.3 certifications record.
Tohoku Murata’s certification QA-7231 [4] records OK for T1–T6 and T8 on the US18650VTC6; T7, overcharge, doesn’t apply to a cell. It is the maker’s own Quality Assurance certification, not an independent lab’s, issued in 2017 for tests run in July 2015. Sony’s QA-C5111 [5] reports the same test run. Both name a similar model for the package tests. Their tables also print what each cell did: a 2015 maker sample, not our lot.
PRINTED IN [4]FIG 7.1
Highest temperature, T5 external short circuit
T5 external short circuit 10 cells, first cycle, fully charged · 62.5–84.2 °C
Pass limit, T5 “Max. Surface Temperature 170℃≧” [4]
Highest surface temperature each cell reached in T5, as printed in [4]: one tick per cell, the bar spans the lowest to the highest. [4] prints no short-circuit resistance or case temperature. T6 impact is the only other test with a temperature column, and it prints “N” there for all 5 cells, not temperatures; T8 prints no temperatures. Every occurrence code is “N”, defined as no rupture, no fire, no disassembly. The same values appear in [5]. A 2015 maker sample, not our lot.
DATA TABLE · FIG 7.1
| TEST | CELLS | MAX °C, EACH CELL | RANGE |
|---|---|---|---|
| T5 external short circuit | 10 | 66.2, 84.2, 79.2, 80.9, 81.8, 62.5, 81.8, 80.1, 80.9, 73.6 | 62.5–84.2 |
PRINTED IN [4]FIG 7.2
Voltage kept through T1–T4
Pass criterion residual OCV 90 % or more [4]
T1 altitude 99.8 % [4]
T2 thermal 98.4–98.5 % [4]
T3 vibration 100.0 % [4]
T4 shock 100.0 % [4]
Open-circuit voltage after each test, as a percent of the voltage before it, printed for each of the 10 cells in [4]: one tick per value. The same 10 cells went through T1 to T4 in turn, starting at 4.193–4.196 V, fully charged. Mass loss was 0.00 % for each cell in each test, against 0.2 % or less. The scale starts at 85 %.
PRINTED IN [4]FIG 7.3
Mass of the cells in the report
g
45.146.648.11234567891046.6 + 1.5 g [1]46.6 − 1.5 g [1]
Cell
Mass of the 10 cells weighed before T1, as printed in [4]: 46.36–46.47 g (mean 46.41 g, our arithmetic), inside 46.6 ± 1.5 g [1]; 46.6 g typical [2]. The axis starts at 44.8 g.
DATA TABLE · FIG 7.3
| CELL | STATE | BEFORE T1 g |
|---|---|---|
| 01 | first cycle, fully charged | 46.46 |
| 02 | first cycle, fully charged | 46.42 |
| 03 | first cycle, fully charged | 46.39 |
| 04 | first cycle, fully charged | 46.43 |
| 05 | first cycle, fully charged | 46.36 |
| 06 | first cycle, fully charged | 46.36 |
| 07 | first cycle, fully charged | 46.41 |
| 08 | first cycle, fully charged | 46.36 |
| 09 | first cycle, fully charged | 46.47 |
| 10 | first cycle, fully charged | 46.47 |
What the two certifications print
| ITEM | QA-7231 [4], POSTED | QA-C5111 [5], NOT POSTED |
|---|---|---|
| Issued by | Tohoku Murata Manufacturing Co., Ltd., signed by its Quality Assurance Department: the maker’s own certification | Sony Energy Devices Corporation, signed by its Quality Assurance Department: the maker’s own certification |
| Dated | 2017/09/01 | 2015/10/07 |
| Cell tests run | 2015/07/14~2015/07/29, Koriyama site | the same dates and site |
| Rating printed | 3.6 V · 3000 mAh · 10.8 Wh | the same |
| T1–T4: 10 cells, first cycle, fully charged | OK; residual OCV 98.4–100.0 %, mass loss 0.00 % (fig 7.2) | OK; the same per-cell values |
| T5: 10 cells, first cycle, fully charged | OK; surface 62.5–84.2 °C, limit “170℃≧” (fig 7.1) | OK; the same per-cell values |
| T6: 5 cells, first cycle, 50% charged | OK; the temperature column prints “N” for all 5 cells | OK; the same |
| T7 overcharge | not applicable to a cell | not applicable to a cell |
| T8: 20 cells, fully discharged (1–10 first cycle, 11–20 after 50 cycles) | OK; “N” for all 20 cells | OK on the summary page; the occurrence cells for cells 11–20 are blank |
| Package tests | “Murata's similar model name for packing : UST180HLTC5A(AE)”; packed cell US18650VTC5A; 2015/03/16~2015/03/19 | “Sony's similar model name for packing : UST180”, with a Japanese note (standard packing, air); packed cell US18650VT4; 2012/11/28~2012/12/01 |
Copied from the scanned pages of [4] and [5]; the reports print no test parameters (no altitude, temperatures, vibration profile, shock pulse, short-circuit resistance, impact mass, or forced-discharge current and time) and no observation periods. [4] names its package-test model “UST180HLTC5A(AE)” and [5] “UST180”; both package tests were run on other cell models, before the VTC6 cell tests.
Reliability tests in [1] §5.6
| TEST | METHOD, AS PRINTED IN [1] | CRITERIA | SECTION |
|---|---|---|---|
| Heat cycle | 1) Standard charge 2) Heat cycle at 75℃6h←30min→-40℃6h for 10cycles. 3) Storage at 20 +/- 5℃ for 24hours | No leakage, No interception | [1] §5.6.1 |
| Shock (drop) | 1) Standard Charge 2) Drop the battery from 1.2m height onto P-tile for 3 times in each of X, Y and Z direction 3) Discharge at 10A, 2.5V cutoff 4) Standard charge 5) Capacity by discharge at 10A, 2.5V cutoff | No leakage, 2565mAh or more | [1] §5.6.2 |
| Vibration | 1) Standard charge 2) Vibration test under the following condition Frequency and acceleration:10-60Hz, 20.6m/s2 Frequency and acceleration:60-80Hz, 13.7m/s2 Frequency and acceleration:80-100Hz, 6.9m/s2 Frequency and acceleration:100-125Hz,3.9m/s2 3) Discharge at 10A, 2.5V cutoff 4) Standard charge 5) Capacity by discharge at 10A, 2.5V cutoff | No leakage, 2565mAh or more | [1] §5.6.3 |
Methods and criteria as printed in [1] (English text). [1] lists these as tests the cell is specified to meet and prints no results. The UN38.3 results above are a different set of tests, from [4] and [5].
08COMPARE
Where the VTC6 sits.
Nine other 18650 cells, each from its own manufacturer document. A higher discharge rating usually costs capacity. The conditions behind each rating differ, so the table quotes each document’s wording.
DOCUMENTS · [1][6]FIG 8.1
Minimum capacity and rated discharge, side by side
- Molicel P28B INR-18650-P28B2,650 mAh minimum · 2,800 typical40 A continuous · 80 °C cut-off
- Molicel P28A INR-18650-P28A2,700 mAh minimum · 2,800 typical35 A max. · 80 oC temp. cut
- Molicel P26A INR-18650-P26A2,500 mAh minimum · 2,600 typical35 A max. · no condition printed
- Sony/Murata VTC6 US18650VTC63,000 mAh minimum · 3,120 nominal30 A continuous max. · with 80 deg temperature cut; 15 A without it
- Samsung 30Q INR18650-30Q62,950 mAh minimum · 3,000 nominal30 A continuous · 80 °C cut-off; 15 A without one
- Molicel P30B INR-18650-P30B2,900 mAh minimum · 3,000 typical30 A continuous · 80 °C cut-off
- Samsung 25R INR18650-25R2,500 mAh minimum · no typical printed20 A max. continuous · at room temperature
- LG HG2 18650HG2Minimum not stated by manufacturer · 3,000 nominal20 A for continuous discharge · no temperature condition printed
- Molicel M35A INR-18650-M35A3,350 mAh minimum · 3,450 typical10 A max. · no condition printed
- Samsung 35E INR18650-35E3,350 mAh minimum · no typical printed8 A for continuous discharge · no condition printed
Bars show each printed figure, not like-for-like ratings: the P28A, P26A and M35A documents print a maximum discharging current, the others continuous ratings [6]. Orange: the VTC6, from its specification [1]. Its bar shows 30 A, the rating “(With 80 deg temperature cut)”; without the cut it is rated 15 A “(Without 80 deg temperature cut)” [1] §2.5. Bars start at zero: minimum capacity on a 0–3,500 mAh scale, discharge on 0–40 A. The condition sits beside each current. Pulse and other non-continuous figures are left out.
| CELL | TYPICAL OR NOMINAL mAh | MINIMUM mAh | DISCHARGE RATING AS PRINTED | CHARGE RATING AS PRINTED | MASS g |
|---|---|---|---|---|---|
| Molicel P28B INR-18650-P28B |
2,800 typical | 2,650 | “Discharge Current, Continuous: 40 A (80°C cut-off)” | “8.4 A (70°C cut-off)” | 48 max |
|
Molicel P28A INR-18650-P28A |
2,800 typical | 2,700 | “Maximum discharging current 35A (with 80 oC temp. cut)” (cell specification) | “8.4A”, “See Section 4.14” (cell specification) | 48 max |
|
Molicel P26A INR-18650-P26A |
2,600 typical | 2,500 | “Maximum discharging current: 35A” (no condition printed) | “6A” | 48 max |
| Sony/Murata VTC6 US18650VTC6 |
3,120 nominal | 3,000 | “30A” “(With 80 deg temperature cut)” and “15A” “(Without 80 deg temperature cut)”, under “Continuous Maximum Discharge Current” [1] §2.5 | “5.0A” “Continuous” [1] §2.4 (pulse figure not shown) | 46.6 typical |
|
Samsung 30Q INR18650-30Q6 |
3,000 nominal | 2,950 | “Max. continuous discharge: 15A (Without temperature cut) / 30A (With 80℃ temperature cut)” | “Rated charge: CCCV, 4A, 4.20V, 100mA cut-off” | 48 max |
|
Molicel P30B INR-18650-P30B |
3,000 typical | 2,900 | “Discharge Current, Continuous: 30 A (80°C cut-off)” | “9 A (60°C cut-off)” | 47 max |
|
Samsung 25R INR18650-25R |
not printed | 2,500 | “Max. continuous discharge: 20A (@ RT)” | “Rated charge: CCCV, 4A, 4.20V, 100mA cut-off” | 45 max |
| LG HG2 18650HG2 |
3,000 nominal | Not stated by manufacturer | “Max. Discharge Current, For continuous discharge: 20000mA” | “Max. Charge Current: 4000mA” | 48 max |
|
Molicel M35A INR-18650-M35A |
3,450 typical | 3,350 | “Maximum discharging current: 10 A” (no condition printed) | “1.7 A, see Section 4.14” | 48 max |
|
Samsung 35E INR18650-35E |
not printed | 3,350 | “Max. Discharge Current: 8,000mA (for continuous discharge)” (non-continuous figure not shown) | “2,000mA (not for cycle life)” | 50 max |
Text in quotation marks is copied as printed from each manufacturer document, the specification [1] for the VTC6 and documents [6] for the others, newest version in our library, checked by a second reading; notes in parentheses are ours. Links go to the bare-cell listing in our store.
09PACK MATH
From one cell to a pack.
How the single-cell ratings scale in series (S) and parallel (P), as far as the 5S2P the specification allows. Illustrative arithmetic, not a pack rating.
V MAX4.2 × S
charge voltage, 4.20 V [1] §3.3
V NOMINAL3.6 × S
nominal voltage, 3.6 V [1][2]
CAPACITY3.0 × P
Ah rated, 0.2ItA to 2.0 V; 2.7 × P at 10 A to 2.5 V [1] §2.1, §5.5.3.3
CONTINUOUS15 × P
A without the 80 deg temperature cut; 30 × P only with it [1] §2.5*
| CONFIG | CELLS | V MAX | V NOMINAL | Ah RATED | Wh RATED | A, WITHOUT 80 DEG CUT* | A, WITH 80 DEG CUT* | CELL MASS g, MAX |
|---|---|---|---|---|---|---|---|---|
| 1S1P | 1 | 4.2 | 3.6 | 3.0 | 10.8 | 15 | 30 | 48 |
| 2S1P | 2 | 8.4 | 7.2 | 3.0 | 21.6 | 15 | 30 | 96 |
| 3S1P | 3 | 12.6 | 10.8 | 3.0 | 32.4 | 15 | 30 | 144 |
| 4S1P | 4 | 16.8 | 14.4 | 3.0 | 43.2 | 15 | 30 | 192 |
| 5S1P | 5 | 21.0 | 18.0 | 3.0 | 54.0 | 15 | 30 | 240 |
| 1S2P | 2 | 4.2 | 3.6 | 6.0 | 21.6 | 30 | 60 | 96 |
| 2S2P | 4 | 8.4 | 7.2 | 6.0 | 43.2 | 30 | 60 | 192 |
| 3S2P | 6 | 12.6 | 10.8 | 6.0 | 64.8 | 30 | 60 | 289 |
| 4S2P | 8 | 16.8 | 14.4 | 6.0 | 86.4 | 30 | 60 | 385 |
| 5S2P | 10 | 21.0 | 18.0 | 6.0 | 108.0 | 30 | 60 | 481 |
CALCULATED FROM [1]FIG 9.1
Continuous current ceiling, by parallel count
15 A × P, without the cut30 A × P, with the 80 °C cut
The single-cell continuous ratings [1] §2.5 times the parallel count, 15 A “(Without 80 deg temperature cut)” and 30 A “(With 80 deg temperature cut)”. [1] §8.2.6 stops at 2 parallels, so the chart does too. Ceilings before derating, not pack ratings.
* Multiplies a single-cell rating by the number of cells in parallel: 15 A “(Without 80 deg temperature cut)”, or 30 A “(With 80 deg temperature cut)”, which needs a pack that stops discharge before the cell surface reaches 80 ℃ [1] §2.5, §2.8.2. [1] §8.2.6 limits the pack: “The cell configuration in the battery pack is to 2 parallels 5 series at the maximum.”, so the table stops at 5S2P. Wh = 10.8 Wh rated [3][4] × S × P. Mass uses 48.1 g, the 46.6 + 1.5 g upper limit [1] §2.7, and counts cells only. [1] §8.2.4 asks every pack for four protective circuits: overcharge, operating “at less than 4.250V/cell”; over-discharge, at 1.5V/cell to 2.5V/cell; over-current, at less than 5A charging and less than 30A discharging; and over-temperature at the cell surface, discharging “until 80degC.(Including overshoot).”, charging until 60degC and not charging below 0degC. It adds “*Do not combine the different Lot Number cell (the Last 5 letters and figure) into the pack” [1] §8.1. Derate for heat, size the BMS, fusing and interconnects for the derated current. The UN38.3 certification [4] covers the bare cell; a pack you build needs its own UN38.3 testing before it ships as UN3480.
10SIZE AND FIT
Ø18.5 × 65.2 mm, flat top.
Drawn at the data sheet’s maximum, with tube, beside nominal outlines of three common formats. The specification prints 18.35 +0.15 / −0.20 by 65.00 ± 0.2 mm; its upper limits match the data sheet’s maximums.
RATED · [1][2]FIG 10.1
Drawn to scale
All outlines drawn to the same scale. The VTC6 at its maximum dimensions with tube [2]; the other outlines are nominal format sizes, for scale only.
| DIMENSION | VALUE | CONDITION |
|---|---|---|
| Diameter | 18.5 mm | “Max. 18.5 mm”, with tube [2]; 18.35 +0.15 / −0.20 mm at the crimp and the trunk, the trunk “(excluding wrinkle on the tube)” [1] §4.1 |
| Height | 65.2 mm | “Max. 65.2mm” [2]; 65.00 ± 0.2 mm [1] §4.1 |
| Mass | 46.6 g | ± 1.5 g [1] §2.7; “Weight (typical)” [2]; 46.36–46.47 g for the 10 cells weighed in [4] |
| Positive end | φ7.4 mm | “Flat portion”, outline drawing [1] §7; as sold, flat top |
| Negative end | φ3 mm | no tab welding at the center: “don’t weld in the renge of φ3 from center” (as printed) [1] §7 |
| Volume | 17.5 cm³ | π × (18.5 ÷ 2)² × 65.2 mm³, the maximum envelope |
Check that your holder or device takes a flat-top cell 65.2 mm long (maximum) [2]. Spot-weld nickel strip for packs, outside the 3 mm circle at the center of the negative end [1] §7; don’t solder to the cell [1] §8.4.
11USE IT RIGHT
Keep it inside its ratings.
What this cell is, and how to use it within its ratings.
- This is a bare cell: a component for protected packs and devices built for it. It is not a standalone consumer battery and not for vaping.
- Flat top, unprotected. Check that your device takes a flat-top cell 65.2 mm long (maximum) [2].
- Charge on a lithium-ion (Li-ion) charger that stops at 4.2 V, the charge voltage [1] §3.3. Stop discharging at 2.5 V: “*It shall avoid less than 2.5V by discharging.” [1] §8.2.2.
- Stay inside the ratings and their conditions: 15 A “(Without 80 deg temperature cut)”, or 30 A “(With 80 deg temperature cut)”, with the cell surface below 80 ℃ [1] §2.5, §2.8.2; discharge between −20 and 60 °C ambient [1][3]; charge at 3.0 A standard, or at most 5.0 A “Continuous” [1] §2.4, by cell temperature (fig 5.4), between 0 and 45 °C, which both [1] and [3] allow.
- Don’t charge a cell that has fallen to 1.0 V or less: [1] §8.2.5 prohibits it.
- Replace a torn wrap before use. Carry cells in a case, never loose.
- For packs: no more than 5S2P [1] §8.2.6, cells of one lot [1] §8.1, a BMS with the protections in section 09 above, fusing, and a way for heat to leave.
Questions? Call 1-800-547-3050 or text 1-833-419-2192 to ask a person.
Documents
Each linked file is posted unaltered, as we received it; versions are listed as printed. The specification [1] is on file but not posted: Sony marks it [Confidential] and Tentative. Sony’s certification QA-C5111 [5] is on file but not posted: QA-7231 [4] restates its cell results.
Ships from Stockbridge, GA. Most in-stock orders ship within 1 business day.
12QUESTIONS
Questions, answered.
Short answers. Where an answer comes from a document, it carries its source; the rest is standard handling practice. Anything else: call 1-800-547-3050 or text 1-833-419-2192.
Is the VTC6 a protected cell?
No. It is a bare flat-top cell with no protection circuit. Use it only in packs with a battery management system (BMS) or in devices built for unprotected cells.
Is it 15 A or 30 A?
Both, under different conditions [1] §2.5. 15 A is the continuous maximum “(Without 80 deg temperature cut)”. 30 A is the continuous maximum “(With 80 deg temperature cut)”: something has to stop the discharge at 80 °C on the cell surface. [1] asks for discharge “below 80℃” at the cell surface (§2.8.2), and for a pack over-temperature circuit that operates discharging “until 80degC.(Including overshoot).” [1] §8.2.4.4. In a pack that is a temperature sensor on the hottest cell, read by the BMS; in a device, its own cell-temperature cut-off. [1] prints no temperature at which discharge may resume. If you don’t know whether your device has a cut-off, use 15 A. In the data sheet’s own tests the cut ended the 30 A discharge after about 1,298 mAh and the 20 A discharge after about 2,209 mAh (fig 3.2) [2]. Neither document prints a pulse discharge rating.
Is it a 3,000 or a 3,120 mAh cell?
Both figures are printed, for the same discharge: 0.2ItA (600 mA) to 2.0 V after a standard charge. 3,000 mAh is the rated capacity, a minimum; 3,120 mAh is the nominal capacity [1] §2.1, §3.1, [2]. No document labels a capacity figure typical. To 2.5 V the minimums are lower: 2,850 mAh at 3.0 A, 2,700 mAh at 10 A and 2,400 mAh at 15 A [1] §5.5.3.
Is it a Sony or a Murata cell?
The model is the same, US18650VTC6, in every document we hold. The 2015 specification [1] and the 2015 UN38.3 certification [5] are issued by Sony Energy Devices Corporation; the data sheet [2] by Murata Manufacturing Co., Ltd.; the SDS [3] and the 2017 UN38.3 certification [4] by Tohoku Murata Manufacturing Co., Ltd. [4] restates the cell results of [5].
Is the VTC6M the same cell?
No. The US18650VTC6M has its own specification and is a different model. None of its figures are on this page.
Can I charge it at 5 A?
Only within the specification’s limits by cell surface temperature [1] §2.8.1 (fig 5.4). 5.0 A is the continuous maximum, “Continuous” [1] §2.4, from 10 to 60 ℃ cell surface; from 0 to 10 ℃ the maximum is 4.00A at 4.15V (condition B, recommended) or 2.00A at 4.25V (condition A). Above 45 ℃ the upper voltage drops to 4.20V and the recommendation to 2.00A. The standard charge is 3.0 A for 2.5 hours [1] §5.3. Above that, use a charger or BMS that reads cell temperature. [1] also prints a pulse charge figure; it is not a continuous rating, so we leave it out.
What charger should I use?
A lithium-ion charger with a CC-CV profile (constant current, then constant voltage) that stops at 4.2 V. [1] prints 4.25V as its “Maximum Charge Voltage” (§2.2), an upper limit, not a target. Not a NiMH, LiFePO4 or lead-acid charger.
Can I charge it at 50 °C?
The documents differ. The specification allows charging from 0 to 60 ℃, “0~+60℃”, and above 45 ℃ cell surface only at 4.20V, 5.00A maximum, 2.00A recommended [1] §2.6, §2.8.1. The SDS says “Charge within the limits of 0°C to 45°C (32°F to 113°F) temperature.” [3] §7. Both allow 0 to 45 °C, so charge there.
How long will it run at my current?
Runtime ≈ capacity ÷ current. From the data-sheet curves, from full in 23deg.C air: about 1 h 00 min at 3 A, 18 min at 10 A and 12 min at 15 A, to 2.5 V; at 30 A about 2.6 min, until the 80deg.C cut (fig 3.9) [2]. For your own draw, divide 2,400 mAh, the minimum at 15 A to 2.5 V [1] §5.5.3.4, by your current in mA to get hours: at 5 A, 2,400 ÷ 5,000 = 0.48 h, about 29 min.
How much does cold reduce capacity?
Little, in the data sheet’s temperature chart: after a charge at 23 °C, at 10 A, the cell delivered about 2,948 mAh at 0 °C and 2,917 mAh at −20 °C, against 2,960 mAh at 23 °C [2], warming itself as it ran (fig 4.5). The chart doesn’t say whether those are air or cell temperatures. The specification’s minimums are lower: 2,160 mAh at 0 °C and 1,890 mAh at −10 °C, at 10 A [1] §5.5.7. Voltage also drops in the cold (figs 4.4 and 4.7), so a device may cut off early. Don’t charge below 0 °C.
How many cycles will it last?
Two documents answer differently, at different conditions. The data sheet’s chart, 4 A charge and 10 A discharge with a 75deg.C cut-off at 23 °C, reads about 2,271 mAh at cycle 300 and 2,066 mAh at cycle 500 (fig 6.1) [2]. The specification rates 1,600 mAh or more after 300 cycles of 4.0A charge (100mA cut-off) and 10A discharge to 2.5V [1] §5.5.4. Neither gives an end-of-life cycle count. Heat, current, depth of discharge and storage all change the result.
Can I use it in a vape or e-cigarette?
No. It is a bare cell: a component for protected packs and devices built for it, not for vaping.
Can I solder to it?
No: “*Do not solder leads directly to the battery body.” [1] §8.4. Spot-weld nickel strip, outside the 3 mm circle at the center of the negative end [1] §7, or use a holder.
Can I mix VTC6 cells with other cells?
No, not in the same pack. [1] says “*Do not combine the different Lot Number cell (the Last 5 letters and figure) into the pack” (§8.1). Use cells of one model and lot, at the same state of charge. In series, the weakest cell reaches 2.5 V first and limits the whole pack.
How should I store spare cells?
In a case, away from metal objects, somewhere dry. The specification recommends 20degC and humidity 50% or less, “free from high temperature (45degC or more)”, and a depth of discharge of 50~80% for long-term storage, about 20 to 50 % charge [1] §8.3. The SDS gives “-20°C to 45°C” [3] §7. Check the voltage every few months.
How does it ship?
As UN3480, lithium-ion batteries, under the SDS [3]. The UN38.3 certification we post, QA-7231 [4], is the maker’s own, for the bare cell. A pack built from these cells needs its own UN38.3 testing.
13SOURCES
Sources and method.
Where every number on this page comes from.
- + Source: [1] Sony Energy Devices Corporation, Product Specifications (Tentative), SONY parts name US18650VTC6, Ver. 0.1, 2015.06.30 (1st issue, as printed; the Spec. No. field holds a placeholder); on file since 2020-11-10; not posted, as Sony marks it [Confidential] and Tentative. Questions about its figures: call or text us
- + Source: [2] Murata Manufacturing Co., Ltd., Cylindrical Type Lithium Ion Secondary Battery US18650VTC6, Version 001 (no date printed); on file 2026-10-20 · Data sheet PDF
- + Source: [3] Tohoku Murata Manufacturing Co., Ltd., Safety Data Sheet No. TMM-TR-A26048, Model Name US18650VTC6, Date Prepared Jan. 01, 2026 (no version printed); on file 2026-10-20 · SDS PDF
- + Source: [4] Tohoku Murata Manufacturing Co., Ltd., Lithium-ion (polymer) rechargeable cell or battery Certification No. QA-7231, Murata model name US18650VTC6, dated 2017/09/01, cell tests 2015/07/14~2015/07/29, to the UN Manual of Tests and Criteria 5th revised edition Amendment 2, Part Ⅲ, subsection 38.3; signed by its own Quality Assurance Department; on file 2026-10-20 · UN38.3 report PDF
- + Source: [5] Sony Energy Devices Corporation, Lithium-ion (polymer) rechargeable cell or battery Certification No. QA-C5111, US18650VTC6, dated 2015/10/07, the same cell tests (2015/07/14~2015/07/29); signed by its own Quality Assurance Department; on file, not posted: [4] restates its cell results, and [4] is the copy we post
- + Source: [6] Molicel INR-18650-P30B data sheet, Version 1.0 (as printed) · copy in our data-sheet library
- + Source: [6] Molicel INR-18650-P28B data sheet, no version printed (as printed) · copy in our data-sheet library
- + Source: [6] Molicel INR-18650-P28A cell specification, Doc # INR18650P28A-01, Rev. 1.2, 2024/05/21 (as printed); on file, not posted, as Molicel marks it confidential
- + Source: [6] Molicel INR-18650-P26A data sheet, Doc # INR18650P26A-01, Rev. 1.2, 8/17/2018 (as printed) · copy in our data-sheet library
- + Source: [6] Samsung INR18650-30Q6 data sheet, Spec. No. INR18650-30Q6, Version 1.0, 2020/06/04 (as printed) · copy in our data-sheet library
- + Source: [6] LG 18650HG2 data sheet, BCY-PS-HG2-Rev0, 2014-04-24 (as printed) · copy in our data-sheet library
- + Source: [6] Samsung INR18650-25R data sheet, Version 1.0, 2016/04/15 (as printed) · copy in our data-sheet library
- + Source: [6] Molicel INR-18650-M35A data sheet, Doc # INR18650M35A-02, Rev. 0.1, 10/21/2019 (as printed) · copy in our data-sheet library
- + Source: [6] Samsung INR18650-35E data sheet, Ver. 1.1, July 9, 2015 (as printed) · copy in our data-sheet library
- + Method: the four charts in [2] are raster images, not vector drawings. Each curve was traced from the chart image at its native resolution (about 245–262 dpi on the page), with the axes mapped from the charts’ own grid lines and ticks and one color per series; where curves overlap, the hidden stretch follows the visible line on either side. Each trace was checked against the original by a second reading. Reading error about ±2 pixels of each chart image: ±20 mAh along each capacity axis, ±0.02 V (±0.03 V on the temperature chart), ±0.02 A, ±2 cycles and ±1 °C. Energy is ∫V dQ along each traced curve; charge time is ∫dQ ÷ I along the traced current. Calculated figures use the formula printed under each. Illustrative; check figures against the current data sheet.
- + Also on file: three older editions of the SDS, TMM-TR-A21047 (Jan. 01, 2021), QA-TR-020361 (Jan. 01, 2020) and QA-TR-91070 (Jan. 01, 2019), all printing the same 0 to 45 °C charge range; superseded by [3] and not cited.
- + Not used: the US18650VTC6M specification, a different model, and a 21700 VTC6A information sheet.
- + Not shown from [1]: its DANGER box, which says the cells are not intended for individual sale or use and may only be used in assembled battery packs; the clauses addressed to Sony’s direct customers (the customer-signature clause, the Pack Check Sheet clause, a clause against resale and the supply notice); its 6.0A pulse charge figure and its tentative over-current protection time table, neither a continuous rating; its safety-standard registrations, which we have not checked; and its Japanese text.
- + Not shown from [2]: Attention notes 1 and 3, that the sheet is downloaded from Murata’s website and subject to change, and that Murata sells these cells only to corporate customers, to be embedded in end products with protection circuits.
- + Not shown: lot measurements. We will add rows from our own lot only once our incoming-inspection procedure is published, with sample size, instrument and date.
Customer Reviews
Overall rating: 4.9 / 5 from 448 reviews.
Fast delivery, safe shipping and just as described - availability like no one else!
This was exactly the battery that I needed, and it was shipped very quickly. I will definitely purchase again when I need it.
Great batteries last a longtime

Prompt and professional service! Great online store! Keep up the excellent work.
Great batteries, last long time
Arrived quick and well packed ,working good
Easy to purchase, shipped fast, quality is great and they work as expected
These are great, I got some on Amazon and they were terrible. Finally found a place that sells good quality hard to find batteries!
They work just just like batteries.
Is as stated. Authentic.

I purchased the batteries to power my portable amateur (ham) radio. The radio requires 2 Amps during transmission and the batteries allow up to 15 Amps which will more than cover its full load during transmission. I look forward to having plenty of reserve power for several hours on a single charge .

Charged to a nominal 3000 mAh as rated. Good price for a high quality cell. Please check if your application takes unprotected flat top cells.
I love buying batteries from this store! The batteries come in nice heavy duty plastic storage cases, they last for a long time, and the company ships promptly.
Perfect replacement for my flashlight batteries, which are getting old and tired. I'm using them in both Wurkkos and Thrunite lights. No issues. Highly recommended!
Quality batteries with prompt shipping.
Delivered in the expected window without issues and all the batteries worked as expected. I would purchase again when needed.

Packaged well... Priced right... Shipped FAST! All good👍🏻. Sony/Murata 18650 batteries🔋.
Seemingly legit, work great.
Decent
Genuine quality brand name batteries and great service.
Good quality.
Exactly what I needed. Came quick and easy!
nice. holds charge.
They were leaking and would not hold a charge
My flashlight was never that bright!
Sony batteries are the highest and safest quality. I always buy them here!!
It's a battery

I use these batteries in my geekvape mod. Typically I’ve bought imren brand batteries off the vape websites that I order from but they seem to only last a few months and I notice right away that one of the batteries will start to charge weird and drain More than the other. I’ve deduced this down to a battery issue and not a mod issue. These batteries have not shown me any problems in the two weeks that I’ve used them and I’m impressed with the quality. Definitely recommend these over any other 18650 battery.
Great batteries
No complaints last all day on one charge
Exact product I was looking for and quick shipping. Wow! Thank you.
Ordered two pairs of the same model 18650; one pair is great, but the other isn’t even comparable in power or longevity. Mildly disappointing.
Have always preferred th Sony batteries, as they've preformed well and last a long time. Also, I'm very pleased with this seller. I've ordered from them before, and they're very quick and keeped me informed through delivery.
Great seller!
Batteries arrived and needed only a few hours to top them off. Good buy.
great!
Haven't got to use the batteries yet, but was very impressed with their promt delivery and packaging, can't wait to test them out and move this t 5 star
Look great work great
Fast charging and consistent reliable power.