
They are great. Your items came fast to my door. Thank you.
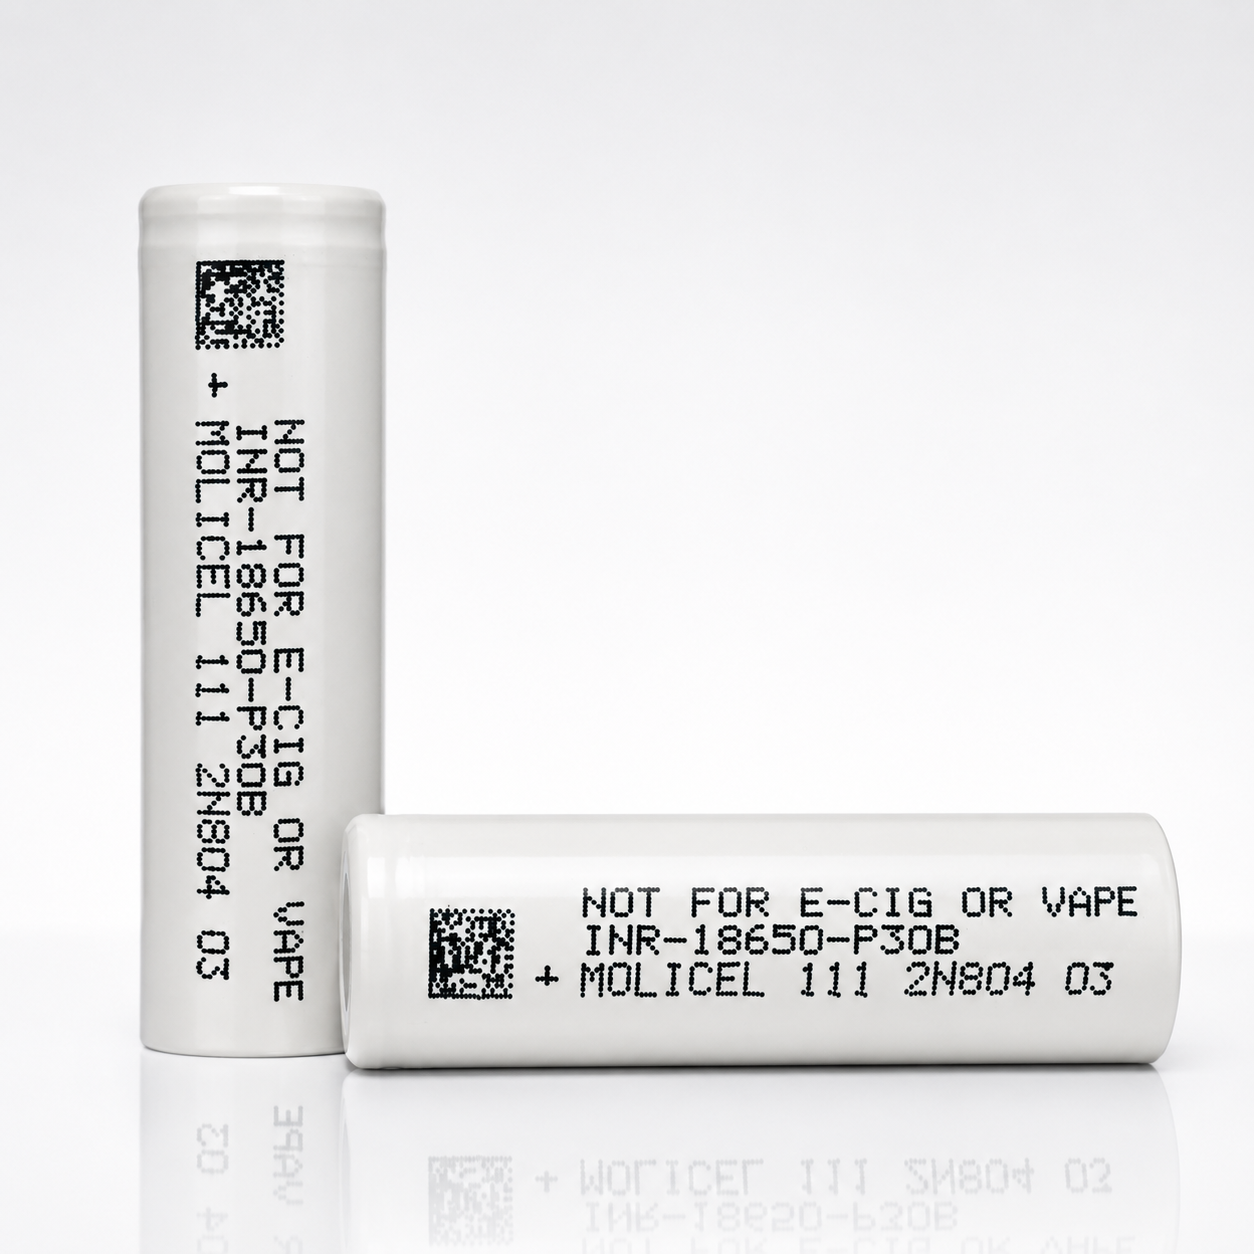
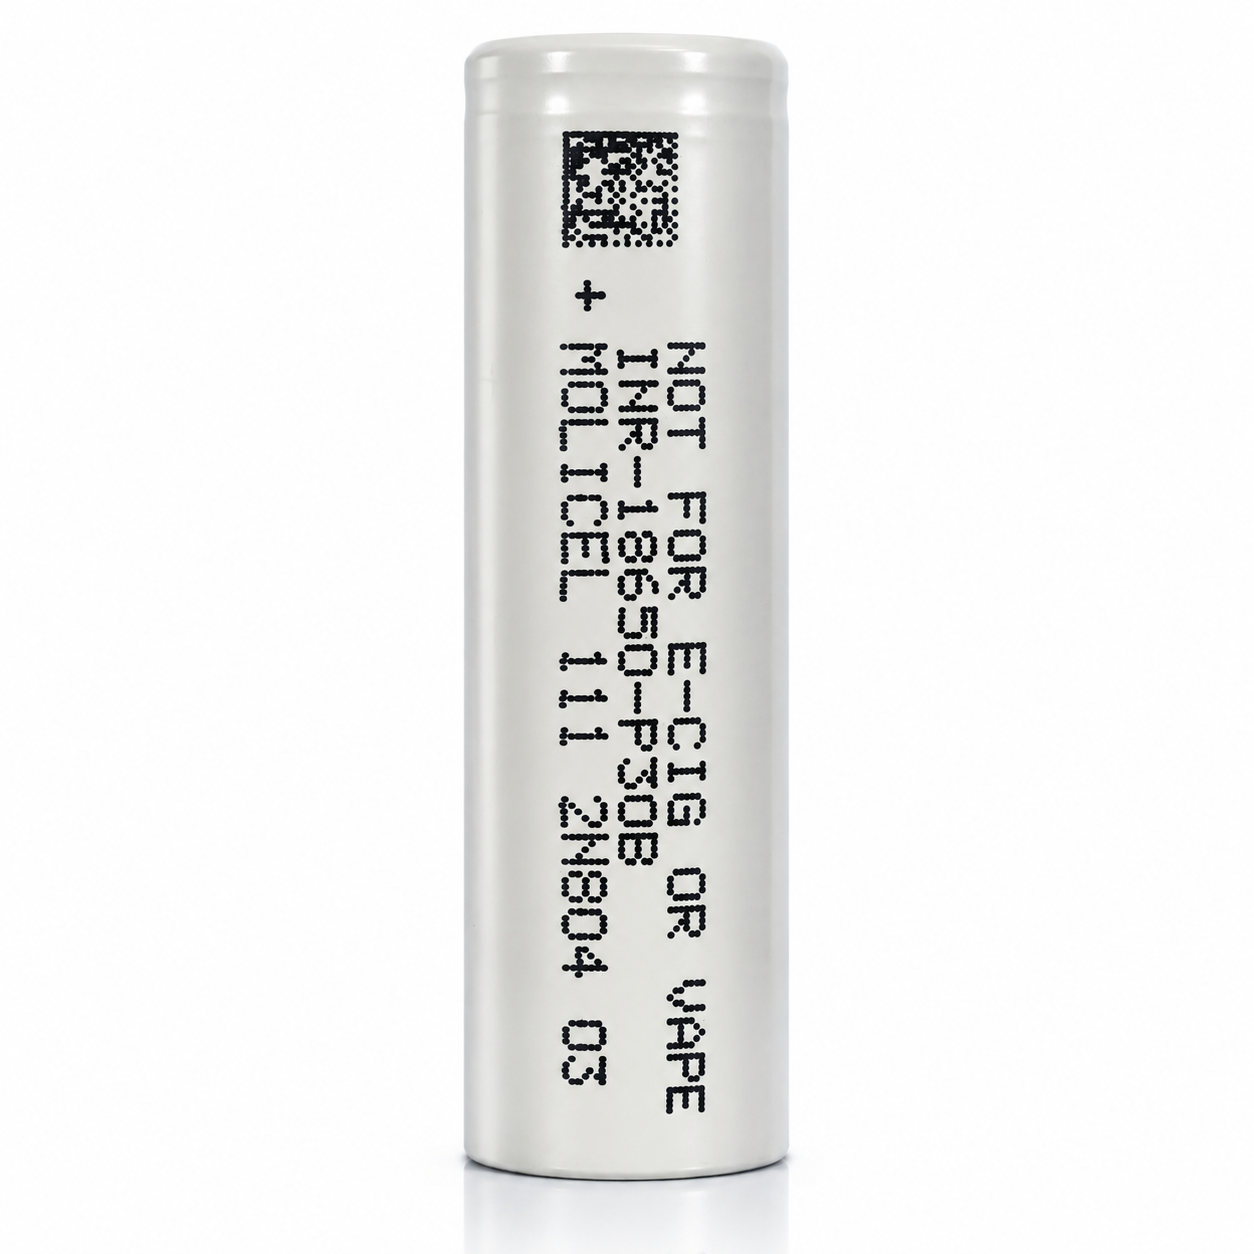
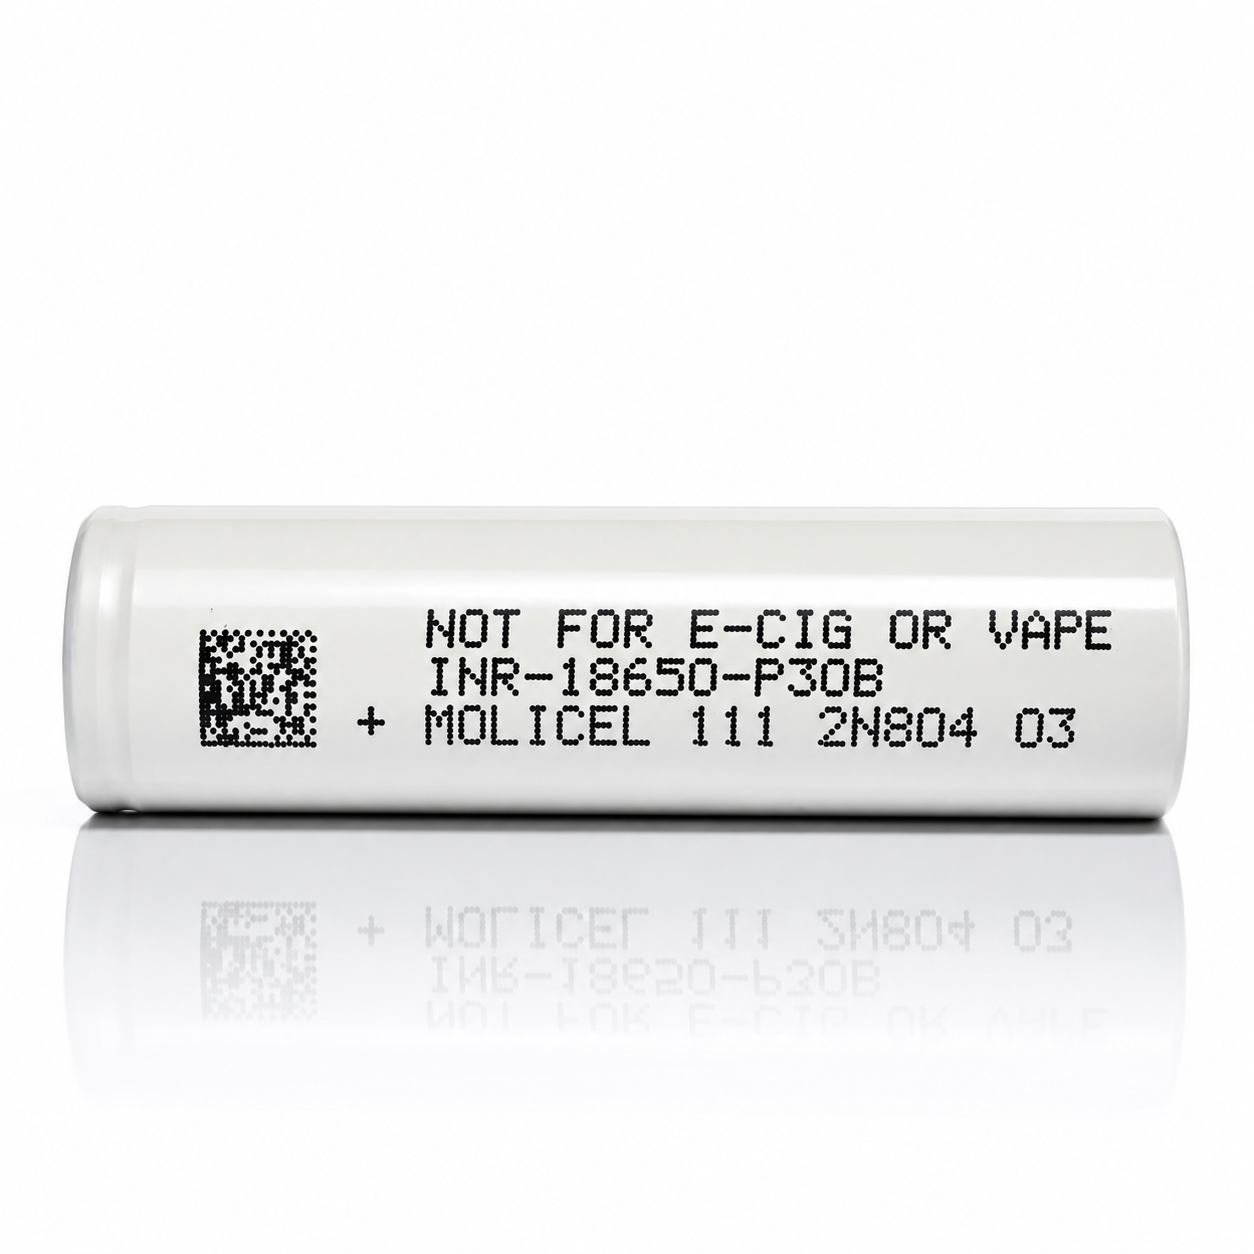
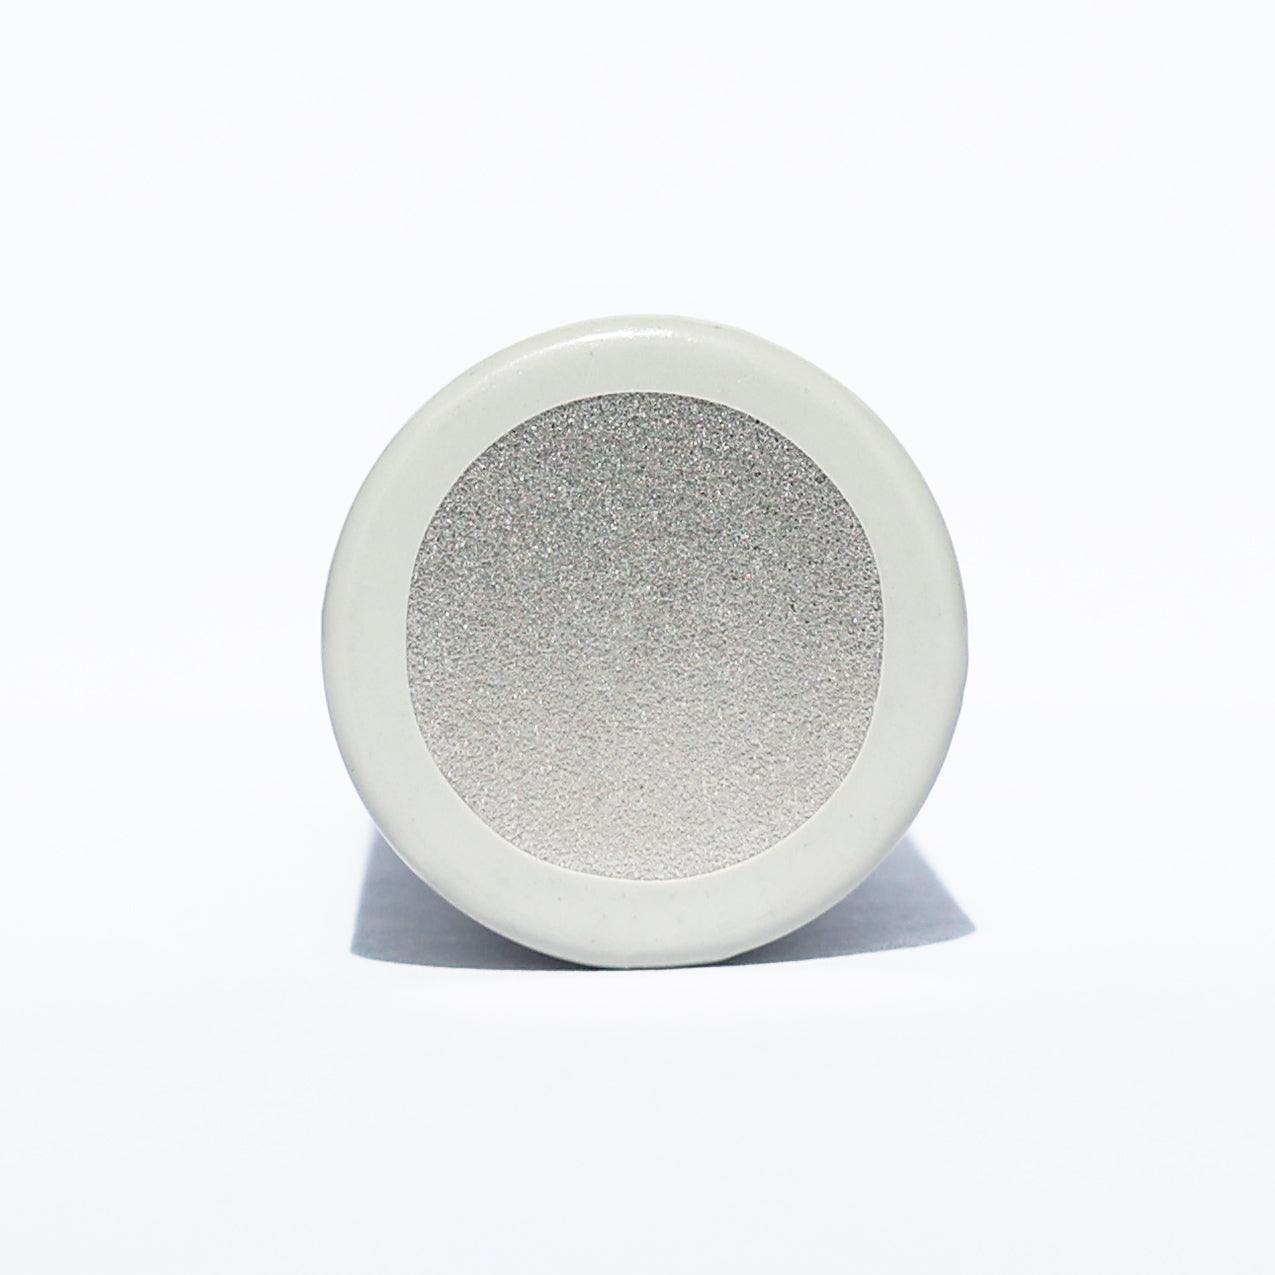


KEY SPECS · MOLICEL INR-18650-P30B
SOURCE [1]- SIZE
- Ø18.6 × 65.2 mm
- max.
- CAPACITY
- 3,000 mAh typ.
- 2,900 mAh min.
- CURRENT
- 30 A
- continuous
- 80 °C cut-off
- TEMPERATURE
- −40 to 60 °C
- discharge
- charge 0 to 60 °C
MOLICEL · 18650 · INR-18650-P30B
An 18650 power cell rated 3,000 mAh typical and 30 A continuous with an 80 °C cut-off [1]. Below: every rating with its condition, the data sheet’s own curves digitized, and what we calculated from them, so you can check each number.
CAPACITY3,000 mAhtypical; 2,900 minimum [1]
CONTINUOUS30 A80 °C cut-off [1]
MAXIMUM CHARGE9 A60 °C cut-off [1]
ENERGY10.8 Whtypical; 10.4 minimum [1]
DC IMPEDANCE17 mΩtypical, at 50 % state of charge (SOC) [1]
MASS47 gmaximum [1]
A bare cell: a component for protected packs and devices built for it. Not for vaping. Charge on a lithium-ion (Li-ion) charger that stops at 4.2 V.
01SPEC PLATE
Every rating, with its condition.
Manufacturer figures first, copied from the data sheet as printed. Then figures we read from its charts, our arithmetic, and facts from the safety data sheet (SDS) and UN38.3 transport test report. Each row names its source or shows its formula.
| SPECIFICATION | VALUE | CONDITION · SOURCE |
|---|---|---|
| RATED · MANUFACTURERcopied from data sheet [1] | ||
| MODEL CODE | INR-18650-P30B | as printed [1] |
| CAPACITY, TYPICAL | 3,000 mAh | 10.8 Wh; test condition not stated [1] |
| CAPACITY, MINIMUM | 2,900 mAh | 10.4 Wh; test condition not stated [1] |
| NOMINAL VOLTAGE | 3.6 V | [1] |
| CHARGE VOLTAGE | 4.2 V | CC-CV (constant current, then constant voltage); data-sheet tests end charge when current falls to 60 mA [1] |
| DISCHARGE CUT-OFF | 2.5 V | [1] |
| STANDARD CHARGE | 3 A | 1.5 h standard charge time [1] |
| MAXIMUM CHARGE | 9 A | 60 °C cut-off [1] |
| CONTINUOUS DISCHARGE | 30 A | 80 °C cut-off [1] |
| CHARGE TEMPERATURE | 0 to 60 °C | cell or ambient not stated [1] |
| DISCHARGE TEMPERATURE | −40 to 60 °C | cell or ambient not stated [1] |
| AC IMPEDANCE | 8 mΩ | typical, at 30 % state of charge (SOC); frequency not stated [1] |
| DC IMPEDANCE | 17 mΩ | typical, at 50 % SOC; method not stated [1] |
| ENERGY DENSITY, VOLUMETRIC | 631 Wh/l | [1] |
| ENERGY DENSITY, GRAVIMETRIC | 234 Wh/kg | [1] |
| DIAMETER | 18.6 mm | maximum [1] |
| HEIGHT | 65.2 mm | maximum [1] |
| MASS | 47 g | maximum; typical not stated [1] |
| SHAPE · CAN | Cylindrical · steel | [1] |
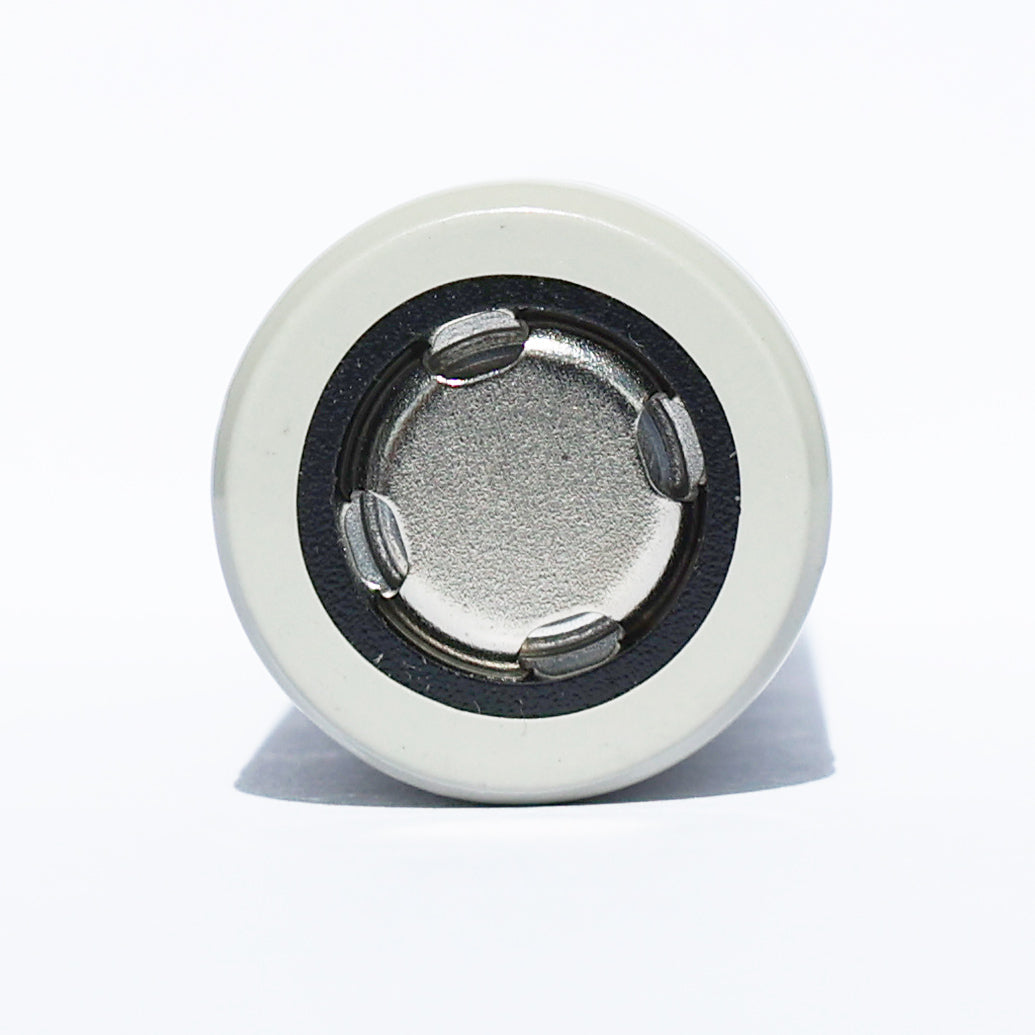
| TERMINAL · PROTECTION | Flat top · none | as sold: bare cell, no protection circuit |
| + Source: [1] Molicel, Product Data Sheet, Model INR-18650-P30B, Version 1.0 (as printed), retrieved 2026-10-19 · Data sheet PDF | ||
| SPECIFICATION | VALUE | CONDITION · SOURCE |
|---|---|---|
| READ FROM DATA-SHEET CHARTSdigitized from [1], ±25 mAh, ±0.02 V | ||
| CAPACITY AT 10 A | 2,854 mAh | CC to 2.5 V, 23 °C ambient [1] |
| CAPACITY AT 20 A | 2,890 mAh | CC to 2.5 V, 23 °C ambient [1] |
| 30 A TRACE END | 2,411 mAh | trace ends at 3.00 V; reason not stated [1] |
| CAPACITY AT 0 °C | 2,645 mAh | 94 % of the 23 °C curve; current not stated [1] |
| CAPACITY AT −20 °C | 2,532 mAh | 90 % of the 23 °C curve; current not stated [1] |
| 9 A CHARGE, CC STAGE | 10 min | ≈1,513 mAh put in (current × time) before CV at 4.2 V [1] |
| RETENTION, 500 CYCLES · 3 A | 87 % | 3 A charge, 3 A discharge, 23 °C ambient [1] |
| RETENTION, 500 CYCLES · 100 W | 70 % | 3 A charge, 100 W discharge with an 80 °C cut-off, 23 °C ambient [1] |
| CALCULATEDarithmetic on [1], shown so you can check it | ||
| 1C | 3.0 A | the current that delivers the typical capacity in one hour: 3,000 mAh [1] ÷ 1 h |
| CONTINUOUS AS C-RATE | 10C | 30 A [1] ÷ 3.0 A |
| MAXIMUM CHARGE AS C-RATE | 3C | 9 A [1] ÷ 3.0 A |
| ENERGY AT 30 A | 8.21 Wh | ∫V dQ along the 30 A curve, to its 3.00 V trace end [1] |
| AVERAGE POWER AT 30 A | 102 W | 30 A × 3.40 V average, to the 3.00 V trace end [1] |
| FROM THE SAFETY DATA SHEET (SDS) AND UN38.3 TRANSPORT TEST REPORTcopied as printed from [2] and [3] | ||
| CHEMISTRY | NCA · graphite | nickel cobalt aluminum oxide (NCA) cathode; graphite anode with 0–2 % silica oxide; SDS Table 3 [2] |
| CAPACITY, MINIMUM · SDS | 2,850 mAh | SDS Table 6 prints 2.85 Ah; this page uses the data sheet’s 2,900 mAh [1][2] |
| MASS · SDS | 46.3 g | as printed, basis not stated; SDS Table 6 [2] |
| MASS · UN38.3 TEST CELLS | 44.72–44.95 g | ten cells weighed by AnTek before test T1 [3]; not our lot |
| LITHIUM CONTENT | 0.9 g | equivalent lithium content, SDS Table 6 [2] |
| TRANSPORT | UN3480 · Class 9 | “UN3480 – Lithium Ion Batteries”; UN3481 when packed with or contained in equipment [2] |
| UN38.3 | TW2109048-001 | T1–T6 and T8 passed (T8 run at 25 A); T7 not applicable to cells; AnTek Certification Inc., 2021-10-19 [3] |
| SAFETY DATA SHEET | FSSF00062AL | version AK as printed, issued 2025-01-10; lists the P30B by name [2] |
| + Source: [1] Molicel, Product Data Sheet, Model INR-18650-P30B, Version 1.0 (as printed), retrieved 2026-10-19 · Data sheet PDF + Source: [2] Molicel, Safety Data Sheet FSSF00062AL, Molicel Rechargeable Lithium-ion cells (INR18650*, INR21700*); version field prints AK, the revision log’s latest entry is AL (January 2025); issued 2025-01-10; on file 2026-10-20 · SDS PDF + Source: [3] AnTek Certification Inc., Lithium Ion Battery Safety Testing Report, INR-18650-P30B, report TW2109048-001, issued 2021-10-19, to the UN Manual of Tests and Criteria Rev. 7; on file 2026-10-20 · UN38.3 report PDF | ||
RATED · [1] + DIGITIZEDFIG 1.1
Voltage window
2.5 V3.6 V4.2 Vcut-offnominalcharge
Black marks: rated voltages [1]. Orange band: where the middle 80 % of capacity is delivered at 0.6 A, 3.09–4.06 V, read from the 0.6 A curve digitized from [1].
RATED · [1]FIG 1.2
Current limits
Standard charge3 A · 1C · 1.5 h
3 A
Maximum charge9 A · 3C · 60 °C cut-off
9 A
Continuous discharge30 A · 10C · 80 °C cut-off
30 A
0102030 A
Currents as rated in [1], each with its condition. C-rates calculated against 3,000 mAh typical. No pulse rating is stated.
RATED · [1]FIG 1.3
Temperature envelope
Discharge−40 to 60 °C
Charge0 to 60 °C
Cut-offs60 °C on 9 A charge · 80 °C on 30 A discharge
−40−20020406080 °C
Operating ranges as rated in [1]. Ticks: the 60 °C cut-off on the 9 A maximum charge and the 80 °C cut-off on the 30 A continuous rating [1]. The 80 °C cut-off sits above the 60 °C discharge range; the data sheet doesn’t explain this, or say whether any of these are cell or ambient temperatures.
02 · DISCHARGE
Discharge at 0.6 A and 30 A.
The data sheet’s lowest and highest discharge currents, digitized. At 0.6 A the cell runs to 2.5 V and delivers about 2,924 mAh. After 1,500 mAh delivered, the 30 A curve sits 0.33 V below the 0.6 A curve, and the 30 A trace ends at 3.00 V after about 2,411 mAh.
0.6 A · 0.2C10.58 Whabout 2,924 mAh to 2.5 V · digitized from [1]; Wh calculated
30 A · 10C8.21 Whabout 2,411 mAh to the 3.00 V trace end, 4.8 min · digitized from [1]; Wh and min calculated
DIGITIZED FROM [1]FIG 2.1
V
2.53.03.54.04.201,0002,0003,0000.6 A · 0.2C30 A · 10CTrace ends at 3.00 V, 2,411 mAh
Capacity, mAh
Data: digitized from [1] Discharge Rate Characteristics · 0.6 A (0.2C) and 30 A · charge CC-CV 3.0 A / 4.2 V · discharge CC to 2.5 V · 23 °C ambient · retrieved 2026-10-19 · data tables under figs 3.1 and 3.2
03BY CURRENT
Capacity, energy and runtime, by current.
Six discharge currents from the data sheet, from 0.6 A to 30 A. The first two figures are the curves; the rest are arithmetic on them, with the formula under each. The curves in 3.1 and 3.2 run within a few hundredths of a volt of each other, so they carry a key instead of labels at the line.
DIGITIZED FROM [1]FIG 3.1
Discharge at 0.6, 1.5 and 3 A
V
2.53.03.54.001,0002,0003,0000.6 A · 0.2C1.5 A · 0.5C3 A · 1C
Capacity, mAh
Data: digitized from [1] Discharge Rate Characteristics · 0.6 A, 1.5 A, 3 A · charge CC-CV 3.0 A / 4.2 V (60 mA) · discharge CC to 2.5 V · 23 °C ambient · retrieved 2026-10-19
DATA TABLE · FIG 3.1
| SERIES | V AT 0 mAh | 500 | 1,000 | 1,500 | 2,000 | 2,500 | END mAh | END V |
|---|---|---|---|---|---|---|---|---|
| 0.6 A · 0.2C | 4.19 | 4.01 | 3.83 | 3.67 | 3.48 | 3.18 | 2,924 | 2.50 |
| 1.5 A · 0.5C | 4.18 | 3.99 | 3.81 | 3.64 | 3.46 | 3.16 | 2,871 | 2.50 |
| 3 A · 1C | 4.15 | 3.95 | 3.78 | 3.60 | 3.43 | 3.13 | 2,846 | 2.50 |
DIGITIZED FROM [1]FIG 3.2
Discharge at 10, 20 and 30 A
V
2.53.03.54.001,0002,0003,000Ends at 3.00 V10 A · 3.3C20 A · 6.7C30 A · 10C
Capacity, mAh
Data: digitized from [1] Discharge Rate Characteristics · 10 A, 20 A, 30 A · charge CC-CV 3.0 A / 4.2 V (60 mA) · discharge CC to 2.5 V · 23 °C ambient · retrieved 2026-10-19
DATA TABLE · FIG 3.2
| SERIES | V AT 0 mAh | 500 | 1,000 | 1,500 | 2,000 | 2,500 | END mAh | END V |
|---|---|---|---|---|---|---|---|---|
| 10 A · 3.3C | 4.09 | 3.83 | 3.67 | 3.51 | 3.34 | 3.07 | 2,854 | 2.50 |
| 20 A · 6.7C | 3.99 | 3.70 | 3.57 | 3.42 | 3.26 | 3.00 | 2,890 | 2.50 |
| 30 A · 10C | 3.89 | 3.58 | 3.48 | 3.34 | 3.19 | trace ended | 2,411 | 3.00 |
CALCULATED FROM [1]FIG 3.3
Capacity delivered, by current
End of each digitized curve in [1]: 2.5 V, except the 30 A trace, which ends at 3.00 V. The data sheet doesn’t say why that trace stops there; the 30 A rating carries an 80 °C cut-off. The 20 A curve runs slightly past the 3 and 10 A curves, as printed; the data sheet doesn’t say why, and self-heating is one possible reason.
CALCULATED FROM [1]FIG 3.4
Energy delivered, by current
Energy = the area under each voltage–capacity curve (∫V dQ), digitized from [1] Discharge Rate Characteristics. The 30 A figures stop at 3.00 V, where its trace ends; the others run to 2.5 V. Data-sheet rating for comparison: 10.8 Wh typical, 10.4 Wh minimum [1].
CALCULATED FROM [1]FIG 3.5
Voltage sag, by current
V
3.03.253.53.754.00102030after 500 mAhafter 1,500 mAhafter 2,300 mAh
Discharge current, A
Cell voltage after the same capacity delivered, read from each curve in [1]. At 1,500 mAh the 30 A curve sits 0.33 V below the 0.6 A curve: 0.33 V ÷ 29.4 A ≈ 11 mΩ, and 8–15 mΩ from 2,300 to 500 mAh. Effective resistance = (V at 0.6 A − V at 30 A) ÷ (30 − 0.6) A at the same capacity delivered; arithmetic, not a data-sheet rating. The data sheet doesn’t explain why this is below its 17 mΩ DC impedance (50 % SOC); self-heating and test method are possible reasons.
DATA TABLE · FIG 3.5
| DEPTH | 0.6 A | 1.5 A | 3 A | 10 A | 20 A | 30 A | mΩ, 0.6 → 30 A |
|---|---|---|---|---|---|---|---|
| 500 mAh | 4.01 | 3.99 | 3.95 | 3.83 | 3.70 | 3.58 | 15 |
| 1,500 mAh | 3.67 | 3.64 | 3.60 | 3.51 | 3.42 | 3.34 | 11 |
| 2,300 mAh | 3.31 | 3.29 | 3.27 | 3.19 | 3.13 | 3.06 | 8 |
CALCULATED FROM [1]FIG 3.6
Average power output, by current
Power = current × average voltage of each digitized curve in [1]. Averages cover each whole curve; the start of a discharge runs higher, the end lower. The 30 A figures stop at 3.00 V, where its trace ends; the others run to 2.5 V. That is why 30 A averages slightly above 20 A.
CALCULATED FROM [1]FIG 3.7
Runtime at a constant current
Runtime = capacity delivered ÷ current, from the curves in [1]: from a full CC-CV charge at 23 °C ambient; the data sheet doesn’t state sample count or cell age. The 30 A figures stop at 3.00 V, where its trace ends; the others run to 2.5 V. A device whose average draw is below its peak current runs longer than the figure at that peak.
CALCULATED FROM [1]FIG 3.8
Estimated heat in the cell, by current
From the curves: I × (V at 0.6 A − V at I)I² × 17 mΩ
Two estimates of heat generated inside one cell, averaged over the discharge. Orange: current × the average voltage gap to the 0.6 A curve, read from [1]. Gray: current² × the 17 mΩ typical DC impedance [1]. The 30 A figures stop at 3.00 V, where its trace ends; the others run to 2.5 V. In a pack, neighboring cells add their heat: plan cooling, and derate.
CALCULATED FROM [1]FIG 3.9
Energy against power
Wh
891011251020501000.6 A1.5 A3 A10 A20 A30 A
Average power, W (log scale)
Each point is one digitized curve from [1] Discharge Rate Characteristics: energy delivered against average power, power on a log scale. The 30 A point is lower partly because its trace ends at 3.00 V.
DATA TABLE · FIG 3.9
| CURRENT | AVERAGE W | ENERGY Wh | RUNTIME |
|---|---|---|---|
| 0.6 A · 0.2C | 2.2 | 10.58 | 4 h 52 min |
| 1.5 A · 0.5C | 5.4 | 10.37 | 1 h 55 min |
| 3 A · 1C | 10.8 | 10.20 | 57 min |
| 10 A · 3.3C | 34.9 | 9.96 | 17 min |
| 20 A · 6.7C | 67.7 | 9.79 | 8.7 min |
| 30 A · 10C | 102.1 | 8.21 | 4.8 min |
04BY TEMPERATURE
Discharge, by temperature.
Eight test temperatures from −40 to 60 °C, digitized from the data sheet. The chart states neither the discharge current nor whether these are ambient or cell temperatures, so compare the curves with each other, not with section 03.
DIGITIZED FROM [1]FIG 4.1
Warm: 23, 45 and 60 °C
V
2.53.03.54.001,0002,0003,00023 °C45 °C60 °C
Capacity, mAh
Data: digitized from the [1] temperature chart · discharge to 2.5 V · the chart states neither the discharge current nor whether these are ambient or cell temperatures · retrieved 2026-10-19
DATA TABLE · FIG 4.1
| SERIES | V AT 0 mAh | 500 | 1,000 | 1,500 | 2,000 | 2,500 | END mAh | END V |
|---|---|---|---|---|---|---|---|---|
| 23 °C | 4.11 | 3.94 | 3.77 | 3.59 | 3.41 | 3.10 | 2,818 | 2.50 |
| 45 °C | 4.09 | 3.98 | 3.80 | 3.63 | 3.42 | 3.12 | 2,868 | 2.50 |
| 60 °C | 4.10 | 3.99 | 3.82 | 3.64 | 3.43 | 3.14 | 2,884 | 2.50 |
DIGITIZED FROM [1]FIG 4.2
Cold: 0, −10 and −20 °C
V
2.53.03.54.001,0002,0003,0000 °C−10 °C−20 °C
Capacity, mAh
Data: digitized from the [1] temperature chart · discharge to 2.5 V · the chart states neither the discharge current nor whether these are ambient or cell temperatures · retrieved 2026-10-19
DATA TABLE · FIG 4.2
| SERIES | V AT 0 mAh | 500 | 1,000 | 1,500 | 2,000 | 2,500 | END mAh | END V |
|---|---|---|---|---|---|---|---|---|
| 0 °C | 3.98 | 3.84 | 3.68 | 3.49 | 3.32 | 2.99 | 2,645 | 2.50 |
| −10 °C | 3.88 | 3.77 | 3.62 | 3.42 | 3.24 | 2.91 | 2,586 | 2.50 |
| −20 °C | 3.70 | 3.68 | 3.53 | 3.34 | 3.15 | 2.71 | 2,532 | 2.50 |
DIGITIZED FROM [1]FIG 4.3
Very cold: −30 and −40 °C, with 23 °C
V
2.53.03.54.001,0002,0003,000Dips to 2.90 V, then recovers23 °C−30 °C−40 °C
Capacity, mAh
Data: digitized from the [1] temperature chart · discharge to 2.5 V · the chart states neither the discharge current nor whether these are ambient or cell temperatures · retrieved 2026-10-19
DATA TABLE · FIG 4.3
| SERIES | V AT 0 mAh | 500 | 1,000 | 1,500 | 2,000 | 2,500 | END mAh | END V |
|---|---|---|---|---|---|---|---|---|
| 23 °C | 4.11 | 3.94 | 3.77 | 3.59 | 3.41 | 3.10 | 2,818 | 2.50 |
| −30 °C | 3.46 | 3.56 | 3.43 | 3.24 | 3.05 | trace ended | 2,471 | 2.50 |
| −40 °C | 3.24 | 3.43 | 3.30 | 3.12 | 2.93 | trace ended | 2,397 | 2.50 |
CALCULATED FROM [1]FIG 4.4
Capacity delivered, by test temperature
End capacity of each digitized temperature curve in [1], at 2.5 V. Discharge current not stated on the chart.
CALCULATED FROM [1]FIG 4.5
Average voltage, by test temperature
V
3.03.23.43.63.8−40−2002040603.163.393.533.583.60
Test temperature, °C
Average voltage = energy ÷ capacity for each digitized temperature curve in [1]. Lower voltage at the same current means less power and more heat.
DATA TABLE · FIG 4.5
| TEMPERATURE | CAPACITY mAh | % OF 23 °C | ENERGY Wh | AVERAGE V |
|---|---|---|---|---|
| 60 °C | 2,884 | 102 | 10.38 | 3.60 |
| 45 °C | 2,868 | 102 | 10.29 | 3.59 |
| 23 °C | 2,818 | 100 | 10.08 | 3.58 |
| 0 °C | 2,645 | 94 | 9.34 | 3.53 |
| −10 °C | 2,586 | 92 | 8.98 | 3.47 |
| −20 °C | 2,532 | 90 | 8.59 | 3.39 |
| −30 °C | 2,471 | 88 | 8.14 | 3.29 |
| −40 °C | 2,397 | 85 | 7.57 | 3.16 |
05CHARGING
Charging: 3 A standard, 9 A maximum with a 60 °C cut-off.
The data sheet charts its 3 A standard charge and its 9 A maximum charge (60 °C cut-off), both CC-CV to 4.2 V [1]. Figures 5.1 to 5.3 are its traces; 5.4 and 5.5 add up the charge each test actually put in.
DIGITIZED FROM [1]FIG 5.1
Cell voltage while charging
V
3.03.43.84.2015304560753 A · 1C9 A · 3C
Time, min
Data: digitized from [1] Charge Characteristics · 3 A (1C) and 9 A (3C) · CC-CV to 4.2 V · temperature not stated on the chart · retrieved 2026-10-19
DATA TABLE · FIG 5.1
| CHARGE | 0 min | 5 min | 10 min | 15 min | 30 min | 45 min | 60 min |
|---|---|---|---|---|---|---|---|
| 3 A · 1C | 2.99 V | 3.44 V | 3.53 V | 3.61 V | 3.83 V | 4.08 V | 4.20 V |
| 9 A · 3C | 2.99 V | 3.92 V | 4.19 V | 4.20 V | 4.20 V | trace ended | trace ended |
DIGITIZED FROM [1]FIG 5.2
Charge current
A
0369015304560753 A · 1C9 A · 3C
Time, min
Data: digitized from [1] Charge Characteristics · 3 A (1C) and 9 A (3C) · CC-CV to 4.2 V · temperature not stated on the chart · retrieved 2026-10-19
DATA TABLE · FIG 5.2
| CHARGE | 0 min | 5 min | 10 min | 15 min | 30 min | 45 min | 60 min |
|---|---|---|---|---|---|---|---|
| 3 A · 1C | 3.0 A | 3.0 A | 3.0 A | 3.0 A | 3.0 A | 3.0 A | 0.4 A |
| 9 A · 3C | 9.0 A | 9.0 A | 8.9 A | 2.6 A | 0.1 A | trace ended | trace ended |
DIGITIZED FROM [1]FIG 5.3
Charge returned, percent of each test’s own total
%
0255075100015304560753 A · 1C9 A · 3C
Time, min
Data: digitized from [1] Charge Characteristics · 3 A (1C) and 9 A (3C) · CC-CV to 4.2 V · temperature not stated on the chart · retrieved 2026-10-19 · each curve is a percent of its own test’s total: about 2,829 mAh at 3 A and about 2,076 mAh at 9 A (fig 5.4), so the two are not on one scale
DATA TABLE · FIG 5.3
| CHARGE | 0 min | 5 min | 10 min | 15 min | 30 min | 45 min | 60 min |
|---|---|---|---|---|---|---|---|
| 3 A · 1C | 0 % | 9 % | 17 % | 26 % | 53 % | 79 % | 99 % |
| 9 A · 3C | 0 % | 35 % | 71 % | 92 % | 100 % | trace ended | trace ended |
CALCULATED FROM [1]FIG 5.4
Charge put in, mAh
mAh
01,0002,0003,000015304560753 A · 1C9 A · 3C
Time, min
Charge put in = current × time, summed along each current trace digitized from [1]. The 3 A test puts in about 2,829 mAh in all, the 9 A test about 2,076 mAh; the data sheet doesn’t say why the 9 A test took less. Dotted line: 3,000 mAh typical [1].
DATA TABLE · FIG 5.4
| CHARGE | 5 min | 10 min | 15 min | 20 min | 30 min | 45 min | 60 min | TOTAL mAh |
|---|---|---|---|---|---|---|---|---|
| 3 A · 1C | 250 | 501 | 751 | 1,001 | 1,502 | 2,252 | 2,805 | 2,829 |
| 9 A · 3C | 751 | 1,502 | 1,927 | 2,036 | 2,072 | 2,076 | 2,076 | 2,076 |
CALCULATED FROM [1]FIG 5.5
Minutes to put in each amount
3 A standard (1C)9 A maximum (3C), 60 °C cut-off
Minutes to put in each amount, from the current traces digitized from [1] (current × time). The 9 A trace never reaches 2,400 mAh: its test put in about 2,076 mAh in all. Its constant-current stage ends after about 10 min and 1,513 mAh. Standard charge time per the data sheet: 1.5 h at 3 A [1].
DATA TABLE · FIG 5.5
| CHARGE | 1,000 mAh | 1,500 mAh | 2,000 mAh | 2,400 mAh | CC STAGE ENDS | PUT IN AT CC END | TOTAL PUT IN |
|---|---|---|---|---|---|---|---|
| 3 A · 1C | 20 min | 30 min | 40 min | 48 min | 53 min | 2,670 mAh | 2,829 mAh |
| 9 A · 3C | 7 min | 10 min | 17 min | not reached | 10 min | 1,513 mAh | 2,076 mAh |
Before you charge at 9 A (60 °C cut-off)
- 9 A is the data sheet’s maximum, with a 60 °C cut-off. 3 A is the standard rate [1].
- Use a charger or BMS (battery management system) that ends charge at 4.2 V and stops on cell temperature.
- Fast charging puts heat into the cell. In a pack, the middle cells run warmest.
- Charge only between 0 and 60 °C [1]. The data sheet doesn’t say whether that is cell or ambient temperature, so keep both inside it.
06CYCLE LIFE
Capacity over 500 cycles.
Three test programs from the data sheet at 23 °C ambient: standard charge, 9 A fast charge, and a 100 W constant-power discharge. At 100 W the current rises as the voltage falls: 100 W ÷ 4.0 V is 25 A, and 100 W ÷ 2.5 V is 40 A. Near the end of each discharge that is above the 30 A continuous rating; the data sheet runs this test with an 80 °C cut-off [1].
DIGITIZED FROM [1]FIG 6.1
Capacity retention over 500 cycles
%
607080901000100200300400500+1C / −1C and +3C / −1C, overlapping+1C / −100 W
Cycle
Data: digitized from [1] Cycle Characteristics · charge CC-CV 3.0 A or 9.0 A to 4.2 V (60 mA) · discharge CC 3.0 A to 2.5 V, or constant power 100 W to 2.5 V with an 80 °C cut-off · 23 °C ambient · axis starts at 60 % · retrieved 2026-10-19
DATA TABLE · FIG 6.1
| TEST | 100 | 200 | 300 | 400 | 500 CYCLES |
|---|---|---|---|---|---|
| +1C / −1C · charge 3 A, discharge 3 A | 98 % | 96 % | 93 % | 90 % | 87 % |
| +3C / −1C · charge 9 A, discharge 3 A | 98 % | 96 % | 93 % | 90 % | 87 % |
| +1C / −100 W · charge 3 A, discharge 100 W | 95 % | 87 % | 79 % | 74 % | 70 % |
CALCULATED FROM [1]FIG 6.2
Capacity left after 500 cycles
Capacity at cycle 500 as a percent of each test cell’s own starting capacity, read from the digitized chart in [1], about ±0.5 points. The data sheet gives no cycle-life rating and no starting capacity for these tests. A chart reading, not a warranty.
07COMPARE
Where the P30B sits.
Nine other 18650 cells, each from its own data sheet. A higher discharge rating usually costs capacity. The conditions behind each rating differ, so the table quotes each sheet’s wording.
DATA SHEETS · [1][4]FIG 7.1
Minimum capacity and rated discharge, side by side
- Molicel P28BINR-18650-P28B2,650 mAh minimum · 2,800 typical40 A continuous · 80 °C cut-off
- Molicel P28AINR-18650-P28A2,700 mAh minimum · 2,800 typical35 A max. · 80 °C temp. cut
- Molicel P26AINR-18650-P26A2,500 mAh minimum · 2,600 typical35 A max. · no condition printed
- Sony/Murata VTC6US18650VTC63,000 mAh minimum · 3,120 nominal30 A continuous max. · 80 °C temp. cut
- Samsung 30QINR18650-30Q62,950 mAh minimum · 3,000 nominal30 A continuous · 80 °C cut; 15 A without
- Molicel P30BINR-18650-P30B2,900 mAh minimum · 3,000 typical30 A continuous · 80 °C cut-off
- Samsung 25RINR18650-25R2,500 mAh minimum · no typical printed20 A max. continuous · at room temperature
- LG HG218650HG2Not stated by manufacturer minimum · 3,000 nominal20 A for continuous discharge · no temperature condition printed
- Molicel M35AINR-18650-M35A3,350 mAh minimum · 3,450 typical10 A max. · no condition printed
- Samsung 35EINR18650-35E3,350 mAh minimum · no typical printed8 A for continuous discharge
Each cell’s figures copied from its own data sheet [1][4]. Bars start at zero: minimum capacity on a 0–3,500 mAh scale (the one capacity figure nearly every sheet prints), discharge on 0–40 A. The condition sits beside each current. Molicel P28A, P26A and M35A print a “maximum discharging current”, not a continuous one. Pulse and other non-continuous figures are left out.
| CELL | TYPICAL OR NOMINAL mAh | MINIMUM mAh | DISCHARGE RATING AS PRINTED | CHARGE RATING AS PRINTED | MASS g |
|---|---|---|---|---|---|
| Molicel P28B INR-18650-P28B |
2,800 typical | 2,650 | “Discharge Current, Continuous: 40 A (80°C cut-off)” | “8.4 A (70°C cut-off)” | 48 max |
|
Molicel P28A INR-18650-P28A |
2,800 typical | 2,700 | “Maximum discharging current: 35A (with 80 °C temp. cut)” | “8.4A, see Section 4.14” | 48 max |
|
Molicel P26A INR-18650-P26A |
2,600 typical | 2,500 | “Maximum discharging current: 35A” (no condition printed) | “6A” | 48 max |
|
Sony/Murata VTC6 US18650VTC6 |
3,120 nominal | 3,000 | “Continuous Maximum Discharge Current: 30A (With 80 deg temperature cut)” | “Continuous Maximum Charge Current: 5.0A” | 46.6 typical |
|
Samsung 30Q INR18650-30Q6 |
3,000 nominal | 2,950 | “Max. continuous discharge: 15A (Without temperature cut) / 30A (With 80℃ temperature cut)” | “Rated charge: CCCV, 4A, 4.20V, 100mA cut-off” | 48 max |
| Molicel P30B INR-18650-P30B |
3,000 typical | 2,900 | “Discharge Current, Continuous: 30 A (80°C cut-off)” | “9 A (60°C cut-off)” | 47 max |
|
Samsung 25R INR18650-25R |
not printed | 2,500 | “Max. continuous discharge: 20A (@ RT)” | “Rated charge: CCCV, 4A, 4.20V, 100mA cut-off” | 45 max |
| LG HG2 18650HG2 |
3,000 nominal | Not stated by manufacturer | “Max. Discharge Current, For continuous discharge: 20000mA” | “Max. Charge Current: 4000mA” | 48 max |
|
Molicel M35A INR-18650-M35A |
3,450 typical | 3,350 | “Maximum discharging current: 10 A” (no condition printed) | “1.7 A, see Section 4.14” | 48 max |
|
Samsung 35E INR18650-35E |
not printed | 3,350 | “Max. Discharge Current: 8,000mA (for continuous discharge)” (non-continuous figure not shown) | “2,000mA (not for cycle life)” | 50 max |
Text in quotation marks is copied as printed from each manufacturer data sheet [1][4], newest version in our library, checked by a second reading; notes in parentheses are ours. Links go to the bare-cell listing in our store.
08PACK MATH
From one cell to a pack.
How the single-cell ratings scale in series (S) and parallel (P). Illustrative arithmetic, not a pack rating.
V MAX4.2 × S
charge voltage [1]
V NOMINAL3.6 × S
nominal voltage [1]
CAPACITY3.0 × P
Ah, typical; 2.9 × P minimum [1]
CONTINUOUS30 × P
A: the 30 A single-cell rating, 80 °C cut-off [1], times P*
| CONFIG | CELLS | V MAX | V NOMINAL | Ah TYPICAL | Wh TYPICAL | CONTINUOUS A* | CELL MASS g, MAX |
|---|---|---|---|---|---|---|---|
| 1S1P | 1 | 4.2 | 3.6 | 3.0 | 10.8 | 30 | 47 |
| 2S1P | 2 | 8.4 | 7.2 | 3.0 | 21.6 | 30 | 94 |
| 3S1P | 3 | 12.6 | 10.8 | 3.0 | 32.4 | 30 | 141 |
| 4S1P | 4 | 16.8 | 14.4 | 3.0 | 43.2 | 30 | 188 |
| 5S2P | 10 | 21.0 | 18.0 | 6.0 | 108.0 | 60 | 470 |
| 6S1P | 6 | 25.2 | 21.6 | 3.0 | 64.8 | 30 | 282 |
| 7S3P | 21 | 29.4 | 25.2 | 9.0 | 226.8 | 90 | 987 |
| 10S3P | 30 | 42.0 | 36.0 | 9.0 | 324.0 | 90 | 1,410 |
| 10S4P | 40 | 42.0 | 36.0 | 12.0 | 432.0 | 120 | 1,880 |
| 13S4P | 52 | 54.6 | 46.8 | 12.0 | 561.6 | 120 | 2,444 |
| 14S5P | 70 | 58.8 | 50.4 | 15.0 | 756.0 | 150 | 3,290 |
CALCULATED FROM [1]FIG 8.1
Continuous current ceiling (80 °C cut-off), by parallel count
30 A × P: the single-cell rating (80 °C cut-off [1]) times the parallel count. A ceiling before derating, not a pack rating.
* 30 A × P multiplies the single-cell continuous rating (30 A, 80 °C cut-off [1]) by the number of cells in parallel. Cells in a pack run hotter than one cell on a bench: derate, size the BMS, fusing and interconnects for the derated current, and use matched cells of one model and lot. Mass counts cells only. The UN38.3 report [3] covers the bare cell; a pack you build needs its own UN38.3 testing before it ships as UN3480.
09SIZE AND FIT
Ø18.6 × 65.2 mm, flat top.
Drawn at its published maximum beside nominal outlines of three common formats. Flat top with no protection circuit, so it is shorter than protected or button-top 18650s.
RATED · [1]FIG 9.1
Drawn to scale
All outlines drawn to the same scale. The P30B at its maximum dimensions [1]; the other outlines are nominal format sizes, for scale only.
| DIMENSION | VALUE | CONDITION |
|---|---|---|
| Diameter | 18.6 mm | maximum [1] |
| Height | 65.2 mm | maximum [1] |
| Mass | 47 g | maximum [1] |
| Terminal | Flat top | as sold, bare cell |
| Volume | 17.7 cm³ | π × (18.6 ÷ 2)² × 65.2 mm³, the maximum envelope |
Check that your holder or device takes a flat-top cell up to 65.2 mm long. Spot-weld nickel strip for packs; don’t solder to the cell.
10USE IT RIGHT
Keep it inside its ratings.
What this cell is, and how to use it within its ratings.
- This is a bare cell: a component for protected packs and devices built for it. It is not a standalone consumer battery and not for vaping. Molicel states it is not designed or produced for vape or e-cigarette devices [1].
- Flat top, unprotected. Check that your device takes a flat-top cell up to 65.2 mm long.
- Charge on a lithium-ion (Li-ion) charger that stops at 4.2 V. Stop discharging at 2.5 V [1].
- Stay inside the ratings and their conditions: 30 A continuous with an 80 °C cut-off, 9 A maximum charge with a 60 °C cut-off [1].
- Replace a torn wrap before use. Carry cells in a case, never loose.
- For packs: matched cells of one model and lot, a BMS, fusing, and a way for heat to leave.
Questions? Call 1-800-547-3050 or text 1-833-419-2192 to ask a person.
Documents
DATA SHEET · VERSION 1.0 · PDFSDS · FSSF00062AL · PDFUN38.3 REPORT · TW2109048-001 · PDFALL DATA SHEETS
Each document is linked as published by its author. Versions are listed as printed.
Ships from Stockbridge, GA. Most in-stock orders ship within 1 business day.
11QUESTIONS
Questions, answered.
Short answers. Where an answer comes from a document, it carries its source; the rest is standard handling practice. Anything else: call 1-800-547-3050 or text 1-833-419-2192.
Is the P30B a protected cell?
No. It is a bare flat-top cell with no protection circuit. Use it only in packs with a battery management system (BMS) or in devices built for unprotected cells.
What does “30 A continuous, 80 °C cut-off” mean?
It is the data sheet’s continuous discharge rating and its condition: 30 A, with the discharge cut off at 80 °C [1]. The cell has no protection circuit and won’t stop itself, so your BMS or device has to end the discharge at that temperature. The data sheet doesn’t say whether 80 °C is cell or ambient temperature; measure at the cell. In the data sheet’s 30 A curve the trace ends at 3.00 V after about 2,411 mAh, and it doesn’t say why. Cells in a pack run hotter than one cell on a bench, so plan for less than 30 A per cell in a pack.
Why do some listings quote a higher current?
Some listings quote a pulse or burst figure, or a current with its condition left off. We can’t check figures that aren’t on Molicel’s data sheet. The data sheet we link (Version 1.0) states 30 A continuous with an 80 °C cut-off and lists no pulse rating [1], so 30 A is the only discharge figure we publish.
Can I charge it at 9 A?
The data sheet allows 9 A maximum with a 60 °C cut-off; 3 A is standard [1]. In its 9 A chart the constant-current stage lasts about 10 minutes and puts in about 1,513 mAh, half the 3,000 mAh typical capacity; that test puts in about 2,076 mAh in all (figure 5.4). Use a charger or BMS that monitors cell temperature.
What charger should I use?
A lithium-ion charger with a CC-CV profile (constant current, then constant voltage) that stops at 4.2 V. Not a NiMH, LiFePO4 or lead-acid charger.
How long will it run at my current?
Runtime ≈ capacity ÷ current. From the data-sheet curves: about 57 min at 3 A, 17 min at 10 A, 8.7 min at 20 A and 4.8 min at 30 A (to 3.00 V, where the chart’s 30 A trace ends), from full at 23 °C ambient (figure 3.7).
How much does cold reduce capacity?
In the data sheet’s temperature chart, the cell delivered 94 % of its 23 °C capacity at 0 °C, 90 % at −20 °C and 85 % at −40 °C. The chart states neither the current nor whether these are ambient or cell temperatures. Never charge below 0 °C [1].
How many cycles will it last?
The data sheet doesn’t give a cycle-life rating; its chart stops at 500 cycles. At 23 °C ambient it shows about 87 % of starting capacity left after 500 cycles with 3 A charge and 3 A discharge, also 87 % with 9 A charging, and 70 % with a 100 W discharge [1]. It doesn’t say when the cell reaches end of life. Heat, current, depth of discharge and storage all change the result.
Can I use it in a vape or e-cigarette?
No. Molicel states the cell is not designed or produced for vape or e-cigarette devices [1]. It is a component for protected packs and devices built for it.
Can I solder to it?
Don’t solder directly to the cell: the heat can damage the seal and internal parts. Spot-weld nickel strip, or use a holder.
Can I mix P30B cells with other cells?
No, not in the same pack. Use cells of the same model and lot, at the same state of charge. In series, the weakest cell reaches 2.5 V first and limits the whole pack, and mismatched cells drift further apart with every cycle.
How should I store spare cells?
In a case, away from metal objects, in a dry place at about 25 °C: the SDS recommends 25 ± 5 °C and says to avoid temperatures above 80 °C [2]. For long storage keep them part-charged rather than full or empty, and check the voltage every few months.
12SOURCES
Sources and method.
Where every number on this page comes from.
- + Source: [1] Molicel, Product Data Sheet, Model INR-18650-P30B, Version 1.0 (as printed), retrieved 2026-10-19 · Data sheet PDF
- + Source: [2] Molicel, Safety Data Sheet FSSF00062AL, Molicel Rechargeable Lithium-ion cells (INR18650*, INR21700*); version field prints AK, the revision log’s latest entry is AL (January 2025); issued 2025-01-10; on file 2026-10-20 · SDS PDF
- + Source: [3] AnTek Certification Inc., Lithium Ion Battery Safety Testing Report, INR-18650-P30B, report TW2109048-001, issued 2021-10-19, to the UN Manual of Tests and Criteria Rev. 7; on file 2026-10-20 · UN38.3 report PDF
- + Source: [4] Molicel INR-18650-P28B data sheet, no version printed (as printed) · copy in our data-sheet library
- + Source: [4] Molicel INR-18650-P28A data sheet, Doc # INR18650P28A-01, Rev. 1.2, 2024/05/21 (as printed) · copy in our data-sheet library
- + Source: [4] Molicel INR-18650-P26A data sheet, Doc # INR18650P26A-01, Rev. 1.2, 8/17/2018 (as printed) · copy in our data-sheet library
- + Source: [4] Samsung INR18650-30Q6 data sheet, Spec. No. INR18650-30Q6, Version 1.0, 2020/06/04 (as printed) · copy in our data-sheet library
- + Source: [4] Sony/Murata US18650VTC6 data sheet, Murata Version 001; ratings from Sony Ver. 0.1, 2015.06.30 (as printed) · copy in our data-sheet library
- + Source: [4] LG 18650HG2 data sheet, BCY-PS-HG2-Rev0, 2014-04-24 (as printed) · copy in our data-sheet library
- + Source: [4] Samsung INR18650-25R data sheet, Version 1.0, 2016/04/15 (as printed) · copy in our data-sheet library
- + Source: [4] Molicel INR-18650-M35A data sheet, Doc # INR18650M35A-02, Rev. 0.1, 10/21/2019 (as printed) · copy in our data-sheet library
- + Source: [4] Samsung INR18650-35E data sheet, Ver. 1.1, July 9, 2015 (as printed) · copy in our data-sheet library
- + Method: curves digitized by script from the chart images in [1] (axis calibration from tick marks, one color mask per series), each checked against the original by a second reading; reading error about ±25 mAh, ±0.02 V, ±0.5 %. Charge put in is current × time summed along each digitized current trace. Calculated figures use the formula printed under each. Illustrative; check figures against the current data sheet.
- + Not shown: lot measurements. We will add Measured rows only once our incoming-inspection procedure is published, with sample size, instrument and date.
Customer Reviews
Overall rating: 4.9 / 5 from 463 reviews.
Works great in my Radiomaster pocket.
Good quality
Great battery
Great batteries and they came fast. Thank you.
Good product
Molicel batteries are great and this store is phenomenal, like you can easily pay 2 to 3x more...just about anywhere else, actually. I'll just get mine here and let everyone I know that needs them come here too.
Great batteries for ultralight drones. Very good build quality and they came in a nice protective shell. Very happy with these batteries.
These batteries are really awesome! I put them in my big lazer and shot it at the moon. Now there's a new crater that looks like my face.

Awesome experience. I did pay for two day shipping and took longer than expected but the packaging was nice and batteries charged efficiently.
Great cells, all cell tested out higher than the rated output on my XTAR VP4 Dragon. They should work and look great in the DeWalt 20v clear case battery I'm building. Shipping was fast and the price was fair. THANKS! I
Batteries are in great condition, I bought 4 Molicel P30B batteries and when they arrived today they even came in 2 cases for 2 batteries, great customer service as well, if you need 18650’s this is the place to go for sure !!
The batteries perform superbly. They last 2 whole days in my device! I have bought Samsung, eFest and others that did not perform this well out of the box. I will absolutely be buying this brand from here out.
Works perfectly
I do love it, perfect to upgrade my tools. I'll get more for sure.
Shipping was delayed but not 18650 batteries fault. Usps shipped it right past me and to the next major city. Other than that they have been great. I think it would have came early if USPS wouldn't have messed up.

The batteries are rated at 2.85 Amp Hours not 3.000 amp hours like it says on their website
Great experience and great products
Excellent for bike lights and flashlights, thank uou,
Good price works great.
Works just fine but loses charge quickly.
Batteries work great in my uconsole.
Works best
Arrived quickly in great condition

Great product at a great price with super fast delivery. Thank you!
Great batteries and fast shipping! Very happy with these Molicel P30B 18650 batteries. They arrived quickly, well packaged, and in perfect condition. The batteries perform great, hold a strong charge, and feel like a high-quality, reliable product. Everything was exactly as described. I would definitely purchase these again and recommend them to anyone looking for quality 18650 batteries.
Great batteries, smooth transaction
As always. Super fast shipping and the best option of batteries in the business. I will always get my batteries from here.
Quick to order, quick to ship, quality as promised.
No fuss, delivered timely, and at a good price. Would purchase again.
The battery I bought very efficient last a lot longer than the batteries I had before. Way better.!
Great batteries at a reasonable price that were quickly delivered.
These batteries last all day in the vape, hit hard and hold charge!
Great experience, battery came perfectly charged for storage, and seems to perform as expected.
Good batteries. Came highly recommended for vaping. I run 4 in my titan v2 mod. I vape constantly even at work. 4 of these last me newely 36 hrs. Never had a single one stop holding a charge yet and ive been using them over a year possibly over 2
A+++++ Batteries Will buy again
Although the not for vaping text is scary, it works really well!
Works great, no complaints
Fast delivery. The batteries have good power and last in my vape.
Shipped fast, exactly what I ordered at a fair price. Will be back!